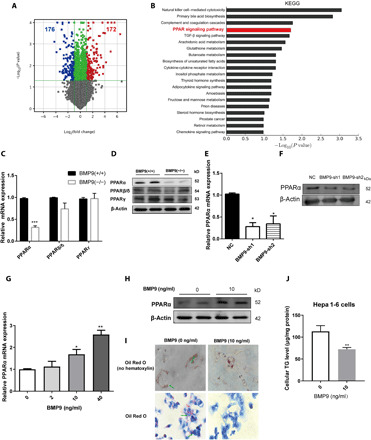
Fig. 4. BMP9 regulates liver lipid metabolism via PPARα signaling.

(A) Volcano plots: Differentially expressed genes (blue, down; red, up) in BMP9-KO mice livers (n = 3). (B) KEGG pathway analysis. PPAR signaling pathway is highlighted (n = 3). mRNA (C) and protein (D) expression of PPARs in the BMP9-KO mouse livers (n = 3). mRNA (E) and protein (F) expression of PPARα in BMP9 knockdown Hepa 1-6 cells. mRNA (G) and protein (H) expression of PPARα in BMP9 knockdown Hepa 1-6 cells treated with mouse recombinant BMP9 protein for 24 hours. (I) Cellular lipid droplets were visualized by Oil Red O staining. (J) Cellular TG levels. *P < 0.05, **P < 0.01, and ***P < 0.001.
