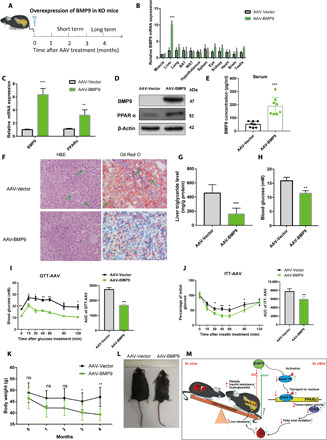
Fig. 6. AAV-mediated BMP9 overexpression attenuates insulin resistance and hepatosteatosis.

(A) Schematic diagram of AAV-BMP9 administration in BMP9-KO mice for 2 or 4 months. (B) mRNA expression of BMP9 in multiple mouse tissues after 2-month AAV-BMP9 treatment. (C) mRNA expression of BMP9 and PPARα in BMP9-KO mouse livers (n = 3). (D) Expression of BMP9 and PPARα proteins in BMP9-KO mouse livers. (E) Serum BMP9 protein concentrations (n = 6). (F) H&E and Oil Red O staining: Hepatic steatosis. Original magnification, ×200. (G) Liver TG level. (H) Initial blood glucose, (I) GTT, and (J) ITT (n = 6). (K) Body weight loss during 4 months of AAV-BMP9 treatment (n = 6). (L) Representative photograph of AAV-BMP9 mice (n = 6). Photo credit: Z. Yang, Photographer Institution, Ninth People’s Hospital, Shanghai Jiao Tong University School of Medicine. (M) Schematic overview. *P < 0.05, **P < 0.01, and ***P < 0.001.
