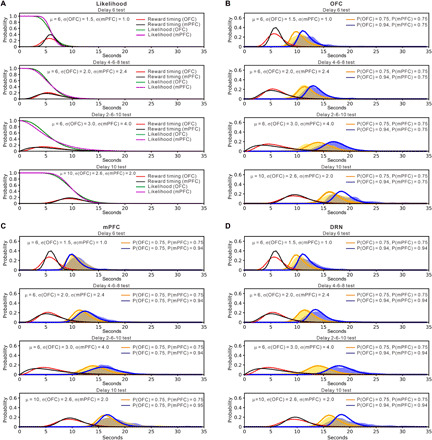
Fig. 6. A model assuming that the OFC and mPFC independently calculate posterior probabilities reproduces features of OFC, mPFC, and DRN photostimulation.

(A) The model assumes that the OFC and mPFC have individual probabilistic models of reward delivery timing (red lines for OFC and black lines for mPFC), which are assumed to be gamma distributions donated by μ and σ. As the time passes without reward delivery, the likelihood of a reward trial diminishes according to the cumulative density function (green lines for OFC and magenta lines for mPFC). (B) Simulation of waiting distribution change caused by OFC optogenetic activation. OFC photostimulation shifts the prior probability of the OFC [Prior(OFC)] from 0.75 to 0.94 and keeps the prior probability of the mPFC [Prior(mPFC)] 0.75. (C) Simulation of waiting distribution change by mPFC optogenetic activation. mPFC photostimulation shifts Prior(mPFC) from 0.75 to 0.94 and keeps Prior(OFC) 0.75. (D) Simulation of waiting distribution change by DRN optogenetic activation. DRN photostimulation shifts both Prior(OFC) and Prior(mPFC) from 0.75 to 0.94. Blue and orange lines show the time of quitting with and without increased prior probability, respectively. Yellow and blue shaded regions indicate distribution of waiting times during omission trials in no-activation and activation of serotonergic neurons, respectively.
