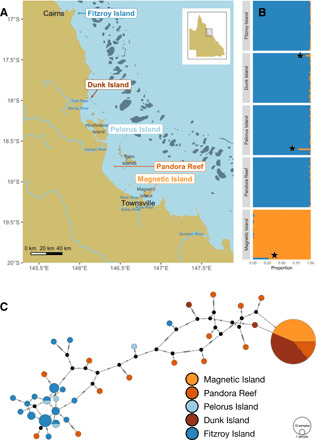
Fig. 2. Population structure of coral host and dominant (Cladocopium) photosymbionts.

Plots (A) and (C) use the same color scheme (bottom right) that shows plume sites in shades of orange and marine sites in shades of blue. (A) Sampling locations in the central inshore GBR, Australia (N = 30 at each site except Magnetic Island, where two genetic outliers were discarded leading to N = 28). Major river systems are labeled and affect sites northward because of the direction of residual inshore current. (B) Coral host admixture proportions based on PCAngsd analysis for each of the five sampling locations. The northern population is shown in dark blue, while Magnetic island is in orange. Samples indicated with a black star represent likely recent hybrids. (C) Mitochondrial haplotype network based on the dominant strain of the symbiont Cladocopium in each sample. Substitutions separating nodes are represented by cross bars.
