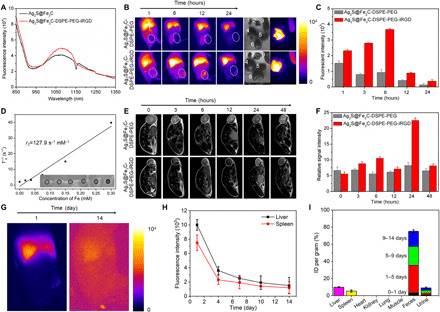
Fig. 5. In vivo imaging and evaluation of biocompatibility for rapid-excretable Ag2S@Fe2C-DSPE-PEG-iRGD.

(A) The fluorescent emission spectrum of Ag2S@Fe2C and Ag2S@Fe2C-DSPE-PEG-iRGD in NIR-II under the excitation of 808-nm laser. (B) Real-time NIR-II fluorescence images of 4T1 breast cancer–bearing mice after intravenous injection of Ag2S@Fe2C-DSPE-PEG and Ag2S@Fe2C-DSPE-PEG-iRGD. Ex vivo fluorescence images of heart (i), kidney (ii), spleen (iii), liver (iv), lung (v), and tumor (vi), which were obtained at 48 hours after injection. Photo credit: Zhiyi Wang, Peking University, China. (C) The fluorescence intensities of the tumor after intravenous injection of Ag2S@Fe2C-DSPE-PEG and Ag2S@Fe2C-DSPE-PEG-iRGD, respectively. (D) T2 relaxation rate (1/T2) as a function of Fe concentration for the Ag2S@Fe2C-DSPE-PEG-iRGD. (E) Real-time MRI of 4T1 breast cancer–bearing mice after intravenous injection of Ag2S@Fe2C-DSPE-PEG and Ag2S@Fe2C-DSPE-PEG-iRGD. (F) The relative MRI signal intensities changing at the tumor site after intravenous injection of Ag2S@Fe2C-DSPE-PEG and Ag2S@Fe2C-DSPE-PEG-iRGD, respectively. (G) The wide-field images show the Ag2S@Fe2C-DSPE-PEG-iRGD luminescence signals in liver and spleen at 1 and 14 days. (H) The excretion of Ag2S@Fe2C-DSPE-PEG-iRGD from mouse liver and spleen can be seen by plotting the signal intensity in these organs (normalized to liver signal observed at 1 day) as a function of time over 2 weeks. (I) Biodistribution of Ag2S@Fe2C-DSPE-PEG-iRGD in main organs and feces of Ag2S@Fe2C-DSPE-PEG-iRGD–treated mice at 14 days. Error bars, means ± SD (n = 3).
