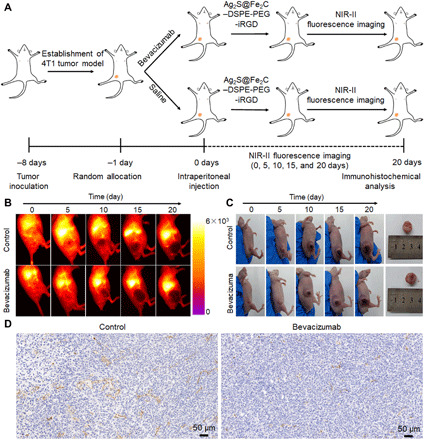
Fig. 6. Self-monitoring for inhibition of tumor angiogenesis.

(A) Schematic illustration of self-monitoring for inhibition of tumor angiogenesis by Ag2S@Fe2C-DSPE-PEG-iRGD after intraperitoneal injection of saline and bevacizumab. (B) Real-time NIR-II fluorescence images of 4T1 breast cancer–bearing mice after intraperitoneal injection of normal saline and bevacizumab by Ag2S@Fe2C-DSPE-PEG-iRGD. (C) Representative photograph for volume change of tumor after intraperitoneal injection of normal saline and bevacizumab in 20 days. Inset: Corresponding harvested 4T1 breast cancer after 20 days. Photo credit: Zhiyi Wang, Peking University, China. (D) CD31 immunohistochemical staining of harvested 4T1 breast cancer after 20 days. Error bars, means ± SD (n = 5).
