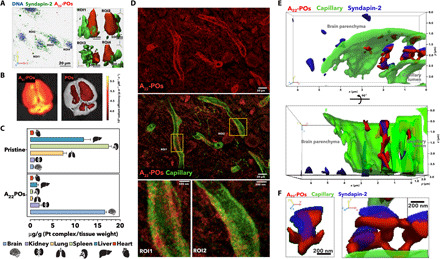
Fig. 4. Syndapin-2–mediated transport.

3D rendering of confocal laser scanning micrographs of polarized BECs incubated with A22-P (red). (A) Cell nuclei were stained with DNA binding DAPI (blue), and syndapin-2 is shown in green (anti-IgG). (B) Fluorescence photograph of ex vivo whole mouse brains imaged 30 min after intravenous injection of A22-P and pristine POs loaded with PtA2. Pt tissue concentration in brain, kidney, lung, spleen, liver, and heart expressed as microgram per gram and measured by ICP-MS. (C) Tissues were collected 30 min after intravenous injection of A22-P and pristine POs both loaded with PtA2. STED micrographs of coronal brain sections showing the distribution of PtA2-loaded A22-P (red) 30 min after injection with capillary stained by lectin (green). (D) Two different regions of interests (ROIs) show the detail of the tubulation across the BECs. (E) 3D renderings as projections of STED micrographs of brain capillary (lectin in green) showing the detail of PtA2-loaded A22-P (red) and syndapin-2 (anti-IgG stained in blue). (F) Details of the tubule formed by the PtA2-loaded A22-P (red) surrounded by syndapin-2 (anti-IgG stained in blue).
