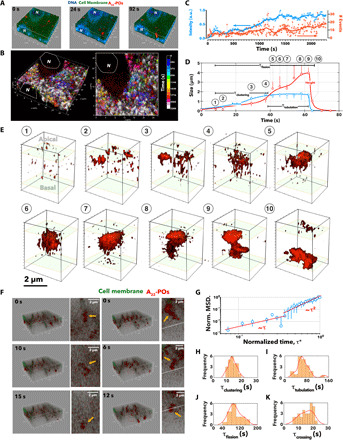
Fig. 5. 4D microscopy of transcytosis.

(A) 3D rendering at three different times extracted from 4D (xyzt) live imaging of BECs stained for cellular membrane CellMask (green) and nuclei (blue) and incubated with Cy5-labeled A22-P (red). (B) 3D renderings of the same cell, with each event color-coded by its occurrence within periods of 144 s. (C) Graphs showing the red channel fluorescence intensity and the number of events (threshold in the red channel) as a function of time and zeta-averaged across the full cell thickness. a.u., arbitrary units. (D) Each event radius and length is monitored over time, and the average values across 20 events are plotted as a function of time. (E) The corresponding 3D renderings of the single events show an evolution from few puncta to large clusters, to membrane-bound tubulations, to tubular carriers. (F) Two sequences of 3D renderings extracted by fast 4D videos of the tubular carriers filled up with Cy5-labeled A22-P (red) crossing from one side to other BECs; note the cell membrane is stained by CellMask (green). (G) Normalized MSD as a function of normalized time , where τcrossing is the time each event takes to fully cross from apical to basal and vice versa. Distribution of τclustering (H), τtubulation (I), and τfission (J) measured from the graph in (D) and τcrossing (K) measured from the graph in (G).
