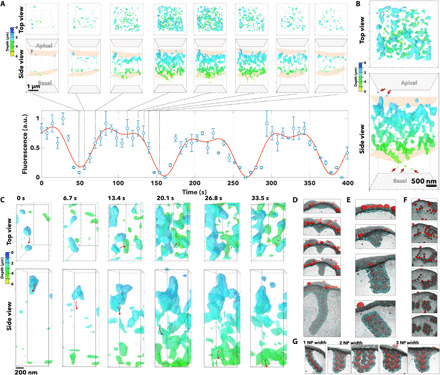
Fig. 6. Super-resolution imaging of the tubular carriers.

(A) 3D renderings shown as top and side views color-coded as a function of the depth (i.e., the distance from apical to basal) of optical sections of BECs incubated with PtA2-loaded A22-P. The 3D rendering was captured at a different time, and the normalized fluorescence measured across each section is plotted as a function of time. (B) The 3D rendering at 120 s is shown enlarged as top and side views and the arrows point at single A22-P particles, while the structure emerged as a network of tubules. (C) Close-up detail of top and side view of the same 3D rendering shows the evolution of the single tubule from apical to basal membrane showing the different stages of tubulation, fission from the apical membrane, and transport and fusion to the basal membrane. The same tubulations were observed in MD simulations. Here, the anisotropic growth of the membrane emerges from the collapse of a tubular aggregate of a particle on the surface. The membrane buckling can occur in different ways depending on the cluster size of assembled nanoparticles, leading to the formation of tubules (D), short tubes (E), or multiple assembly tubules (F). (G) The final tubule can thus be one, two, or three nanoparticles (NP) thick.
