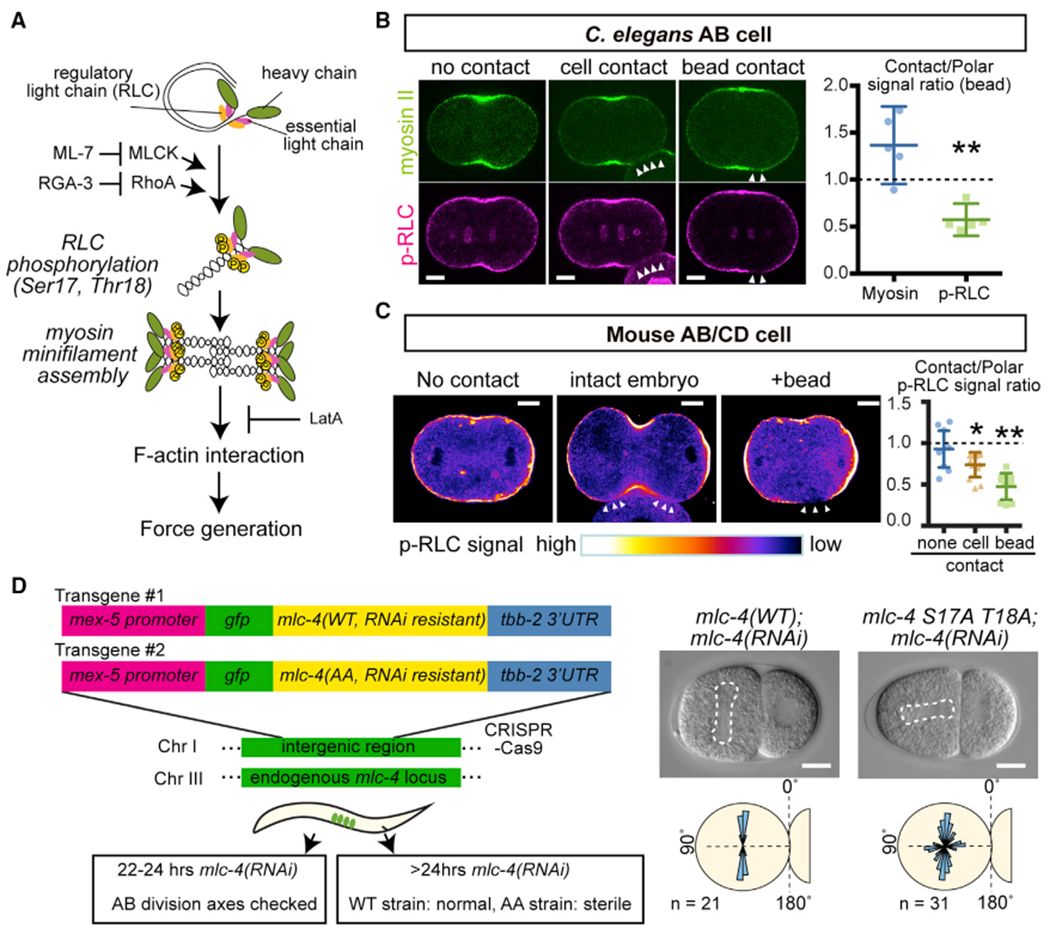
Figure 4. Physical Contact Decreases Myosin Regulatory Light-Chain Phosphorylation.

(A) Schematic representation of myosin activation process.
(B and C) Immunostaining of p-RLC individing C. elegans AB (B) or mouse AB/CD (C) cells. Arrowheads indicate the cell or bead contact site. In (C), p-RLC signal intensity is shown by the bottom color code. Right graph in (B) shows the ratio of signal intensities between bead contact and polar region. In (C), right graph shows the ratio of p-RLC signal intensities between contact and polar region. In the cell without contact, sub-equatorial region was used as “contact signal”. p values were calculated by the Welch’s t test in (B) and by the one-way ANOVA with Holm-Sidak’s multiple comparison test in (C). *p < 0.05 and **p < 0.01.
(D) RLC mutation leads to abnormal C. elegans AB division axis. Left schematics show the experimental design. Single copy transgenes were inserted into the intergenic region and endogenous MLC-4 was knocked-down by 22–24 hr RNAi treatments (see Method Details). Dotted lines in DIC images indicate mitotic spindle. Bottom panels are distributions of mitotic spindle orientations relative to the contact.
Error bars indicate the mean ± 95% confidence interval. Scale bars, 10 μm. See also Figure S3.
