
Figure 6. Asymmetry in Contacting Cell Sizes Is a Sufficient Cue for ABa Division Axis.
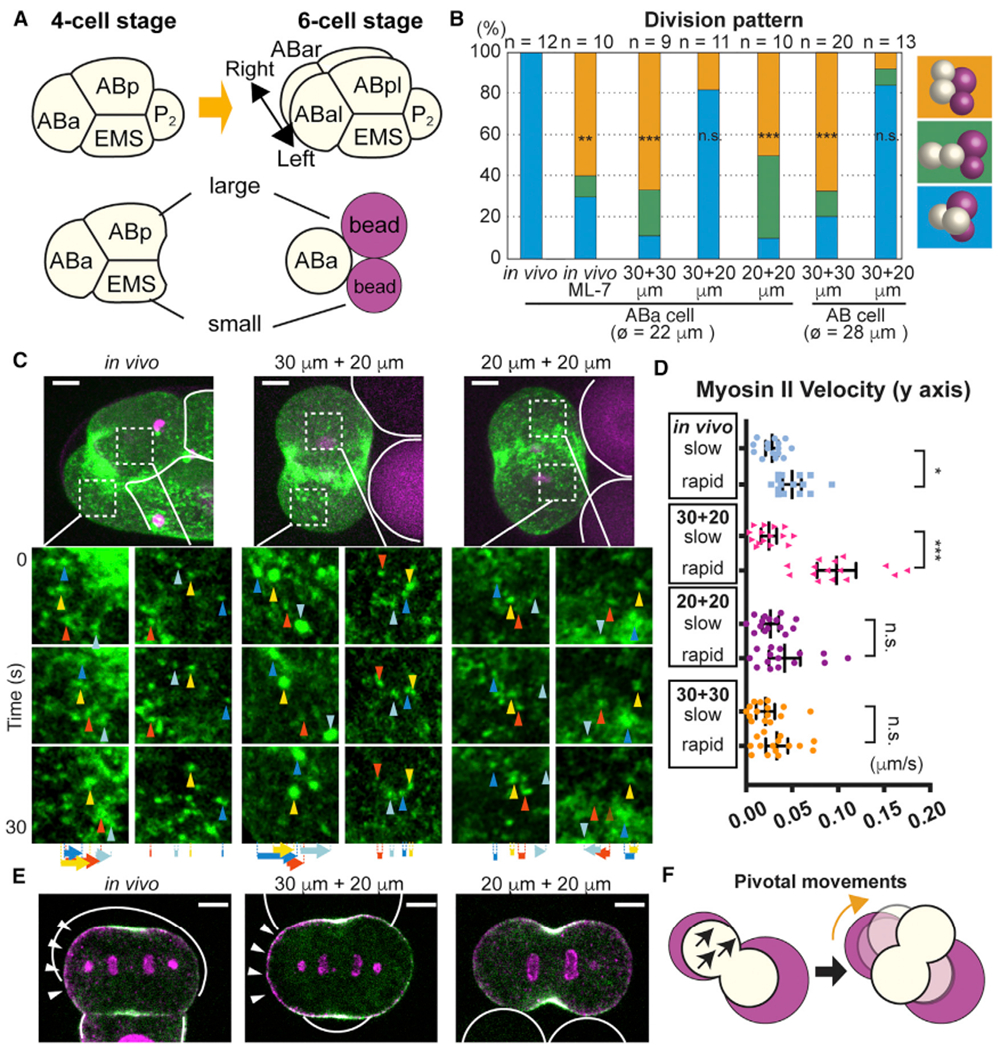
(A) ABa cell division at the four-cell stage and recapitulation of contact asymmetry using beads.
(B) Effects of bead size asymmetry on ABa and AB cell division axes. Color represents different cell division pattern as shown in right; ø = cell diameter.
(C and D) Myosin foci movements during ABa cell division. Myosin foci in the white dotted box were magnified in the bottom panels. Solid white lines indicate contact boundary. Arrowheads and arrows in (C) indicate myosin foci and their total displacement, respectively. Velocities of three myosin foci from each dividing cell half are quantified for five embryos and shown in (D) with the slow or rapid group determined by the average velocities in single embryos.
(E) Polarized p-RLC localization in response to in vivo and in vitro cell/bead contacts. Myosin (green), p-RLC (magenta), cell or bead outlines (white solid lines), and polarized p-RLC (arrowheads) are shown.
(F) Schematic model of ABa division axis orientation (see text). Myosin flow (black arrows) and cell rotation (orange arrows).
Scale bars, 5 μm. p values in (B) were determined with the Fisher’s exact test and those in (D) were calculated by one-way ANOVA with Holm-Sidak’s multiple comparisons test. *p < 0.05; **p < 0.01; ***p < 0.0001; n.s., not significant (p > 0.05). Error bars indicate the mean ± 95% confidence interval. See also Figure S5.