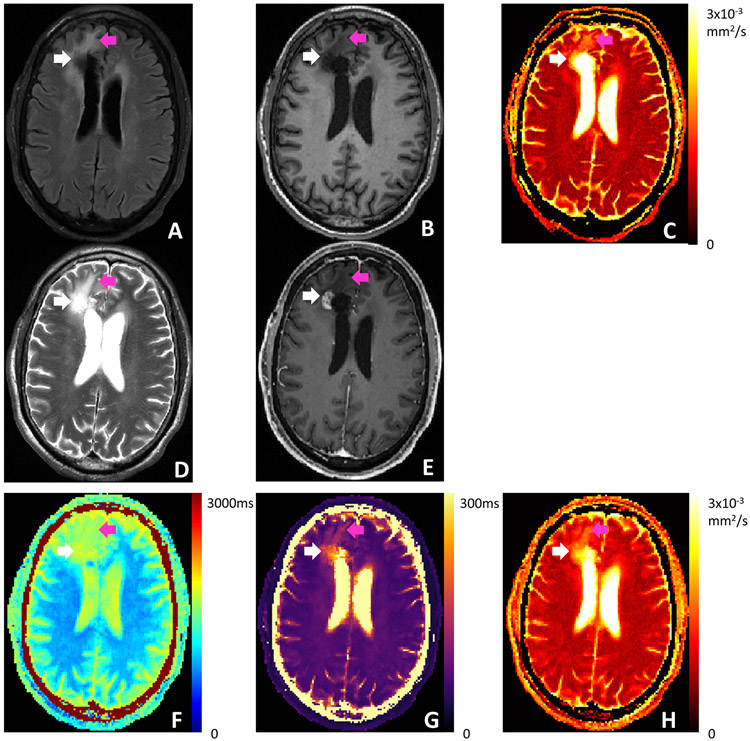
Figure 8.
Clinical images and Multitasking T1/T2/ADC maps of a patient who was previously diagnosed with glioblastoma and underwent chemoradiation and surgery for tumor resection. (A) T2 FLAIR. (B) Pre-contrast T1 MPRAGE. (C) Clinical ADC map using RESOLVE. (D) T2 TSE. (E) Post-contrast T1 MPRAGE. (F-H) T1/T2/ADC maps obtained from Multitasking. White arrows point to the nodular enhancement area identified on post-contrast T1 MPRAGE. Purple arrows point to the surrounding edema. Multitasking T1/T2 maps reflect the tissue characteristics indicated by the clinical qualitative images. Multitasking ADC map is consistent with the clinical ADC map.

