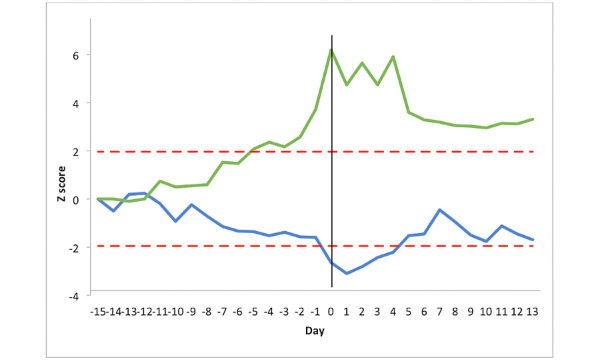
Figure 2.

Chronic obstructive pulmonary disease assessment test score (green line) and peak expiratory flow (blue line) changes pre and post exacerbation in 27 patients with chronic obstructive pulmonary disease. The y-axis represents Z score relative to the patient’s baseline mean. The x-axis represents the time expressed in days. Day −15 is the mean of the stable period, days −14 to −1 is the preexacerbation period, day 0 is the day of initiation of treatment for exacerbation, and days 1 to 13 is the postexacerbation recovery period. The red lines represent the threshold limits of ±1.96 SD.
