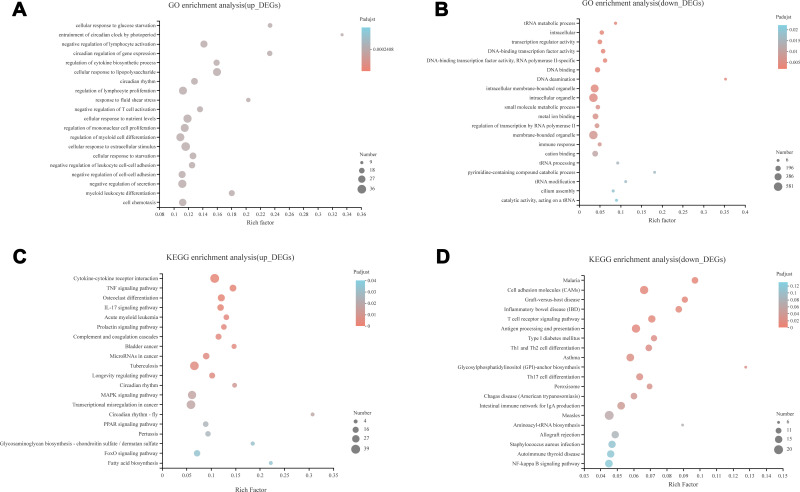
Figure 2.
Bubble diagram of top 20 enriched GO terms and KEGG pathways for significantly differentially expressed genes (DEGs) between ATB and HD. (A) Top 20 ranked GO terms of up-regulated DEGs. (B) Top 20 ranked GO terms of down-regulated DEGs. (C) Top 20 pathways of up-regulated DEGs. (D) Top 20 pathways of down-regulated DEGs. Rich factor: the ratio of genes enriched in the GO term (KEGG) to the number of annotation genes, the enrichment degree was stronger with a bigger Rich factor. The size of dots indicates the number of genes in the GO term (KEGG).
Abbreviations: GO, Gene Ontology; KEGG, Kyoto Encyclopedia of Genes and Genomes.

