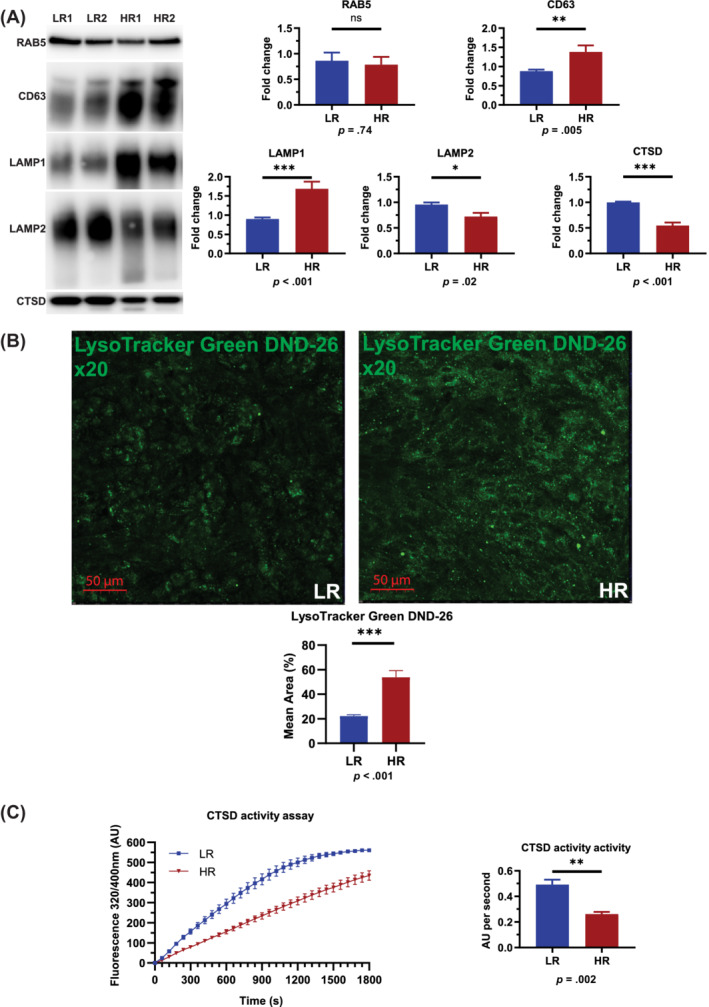
FIGURE 1.

Assessment of lysosomal marker expression in low‐ and high‐risk RPE cells. A, Western blotting quantification shows no changes in RAB5 expression, a significant increase of LAMP1 and CD63 and a significant decrease of CTSD, pro‐CTSD, and LAMP2 expression. All quantification data were normalized to the total protein blots and shown as fold change against low‐risk RPE cells. Data shown as mean ± SEM (data from at least six replicates); B, Fluorescence microscopy analysis shows a significant increase of acidic vesicles detected through LysoTracker Green DND‐26 in high‐risk RPE cells. Data shown as mean ± SEM (data from at least six replicates); C, Cathepsin D activity assay shows a significant decrease of activity in high‐risk compared to low‐risk RPE cells. The activity assays data were normalized against low‐risk RPE cells and shown as fold change. Data shown as mean ± SEM (data from three replicates). Statistical significance was assessed using an unpaired t test. HR, high‐risk retinal pigment epithelium cells; LR, low‐risk retinal pigment epithelium cells; RPE, retinal pigment epithelium
