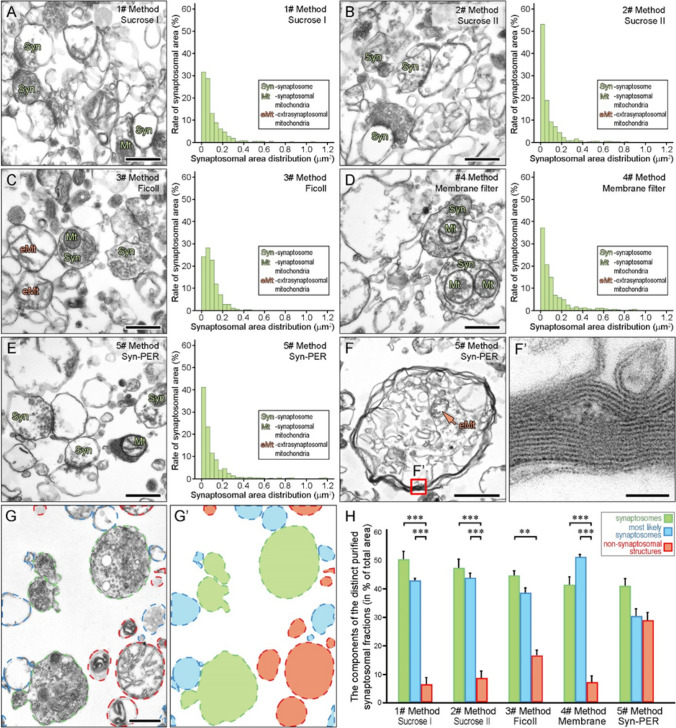
Fig. 1.
Validation and morphometric analysis of the purity of synaptosomal preparations with electron microscopy. a–e) Representative electron micrographs and the histograms of the synaptosomal size distribution are shown for all fractionation methods. f and f’ The left panel (f) shows an irregular-shaped multi-membranous structure in #5 Method preparation at low magnification and the right panel (f’) shows its magnified part. g and g’ Overview of the morphometric method. The left panel (g) shows the selection of the distinct components from an electron micrograph (green, certainly synaptosomes; blue, most likely synaptosomes; red, non-synaptosomal structures), while the one on the right-hand side (g’) presents colorized areas covered by the respective components. h Comparative analysis results on the areas of the subcellular components of the different synaptosomal preparations. **0.001 < p < 0.01; ***p < 0.001 (post hoc Mann–Whitney tests). Means ± SEM are shown for pooled data (12 images per sample) of each preparation. Scale bars: a–e, g: 0.5 µm, f: 1 µm, f’: 50 nm

