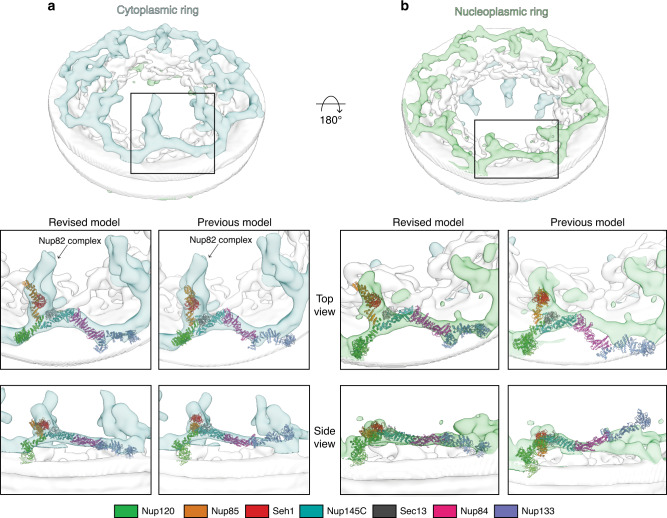
Fig. 7. Fitting of the composite S. cerevisiae Y complex into the cryo-ET map of the NPC.
Cryo-ET map from S. cerevisiae (EMD-10198) with the density corresponding to the a cytoplasmic ring of the NPC colored in light blue and b the nucleoplasmic ring colored in light green. The top-scoring global fit for both the previous (left panel) and revised (right panel) composite S. cerevisiae Y complex models shown in both a top and side view. Y complex nups colored as in legend below.

