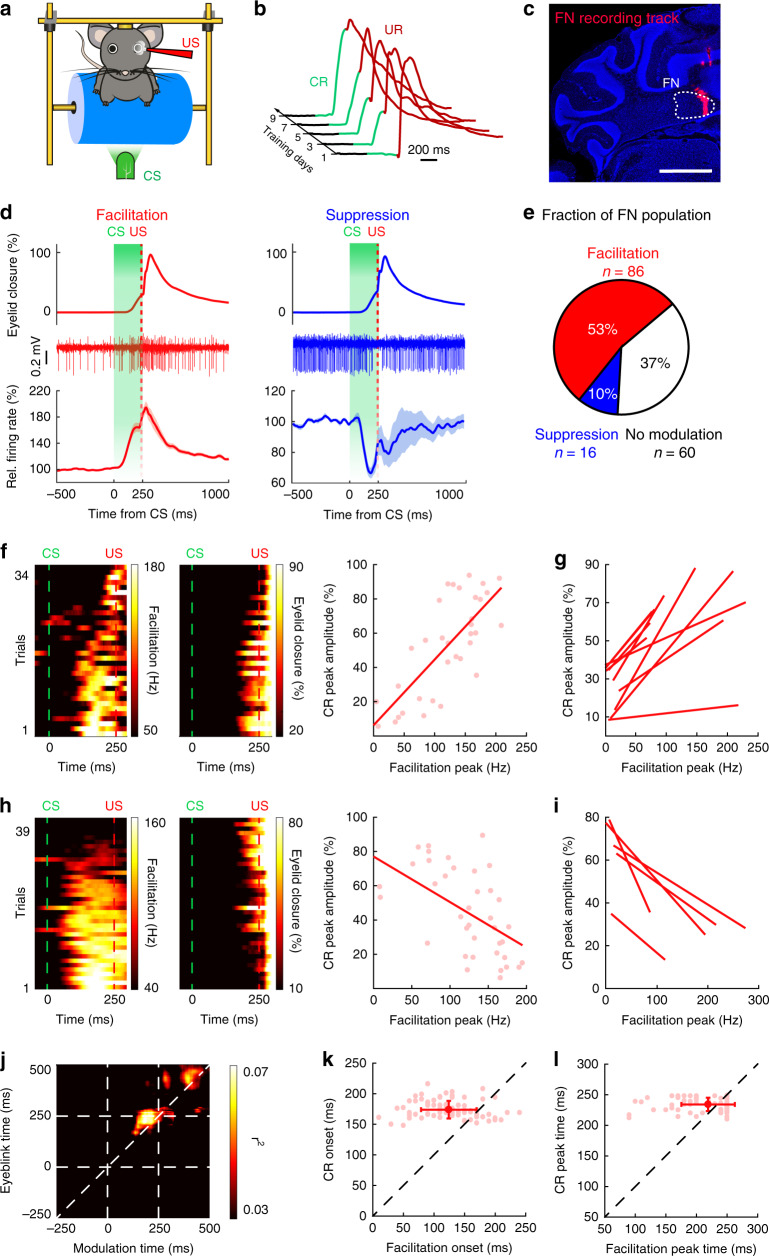
Fig. 1. Extracellular electrophysiological recordings of FN neurons during DEC.
a–c Schematic of the experimental design. a Head-fixed mouse is presented with a green LED light as the conditioned stimulus (CS) and a periorbital air puff as the unconditioned stimulus (US). b Conditioned responses (CRs, green) emerge over training days, prior to the onset of unconditioned responses (URs, red) during DEC training. c An example of DiI-labeled recording track in the cerebellum showing the electrophysiological recording location in the FN (n = 7 mice). Scale bar, 1 mm. d Activity of FN neurons during DEC. Top and middle rows: example traces of eyelid movement and single unit activity of FN neurons with CS-related facilitation (left) and suppression (right). Bottom row: group average of activity patterns for each modulation type (n = 86 for facilitation neurons; n = 16 for suppression neurons; mean ± s.e.m.). Green shading indicates the CS–US interval. e Fraction of FN neurons with different modulation types. f Heatmaps: an example cell with a positive correlation between neuron activity (left) and CR amplitude (right). Each row in the left heatmap represents a single trial recording and each row in the right heatmap represents the corresponding CR amplitude from the same trial. Trials are ordered from top to bottom by their peak facilitation amplitudes. Dashed lines indicate CS and US onsets. A positive trial-by-trial correlation between facilitation and CR amplitudes is shown in the right panel (linear regression model, P = 2.74e−7) and each dot represents a single trial. g Summary of all facilitation cells with a positive correlation (linear regression model, P < 0.05, n = 10). h Same as (f), but for a neuron with a negative trial-by-trial correlation between facilitation and CR amplitudes (linear regression model, P = 0.0003). i Same as (g), but for cells with a negative correlation (linear regression model, P < 0.05, n = 5). j Average correlation matrix of 86 facilitation FN cells. Each epoch indicates the mean r2 value of the trial-by-trial correlation between the FN neuron activity and eyelid closure at a given time point throughout the task. Most-correlated epochs (bright pixels) are located above the diagonal line and before US onset. CS and US onsets are denoted by dashed lines in both dimensions. k Summary of the relationship between facilitation onset and CR onset for all facilitation cells (mean ± SD, n = 86, paired two-sided t test, P = 1.05e−14). l Same as (k), but for the relationship of peak timings (mean ± SD, n = 86, paired two-sided t test, P = 0.0024).

