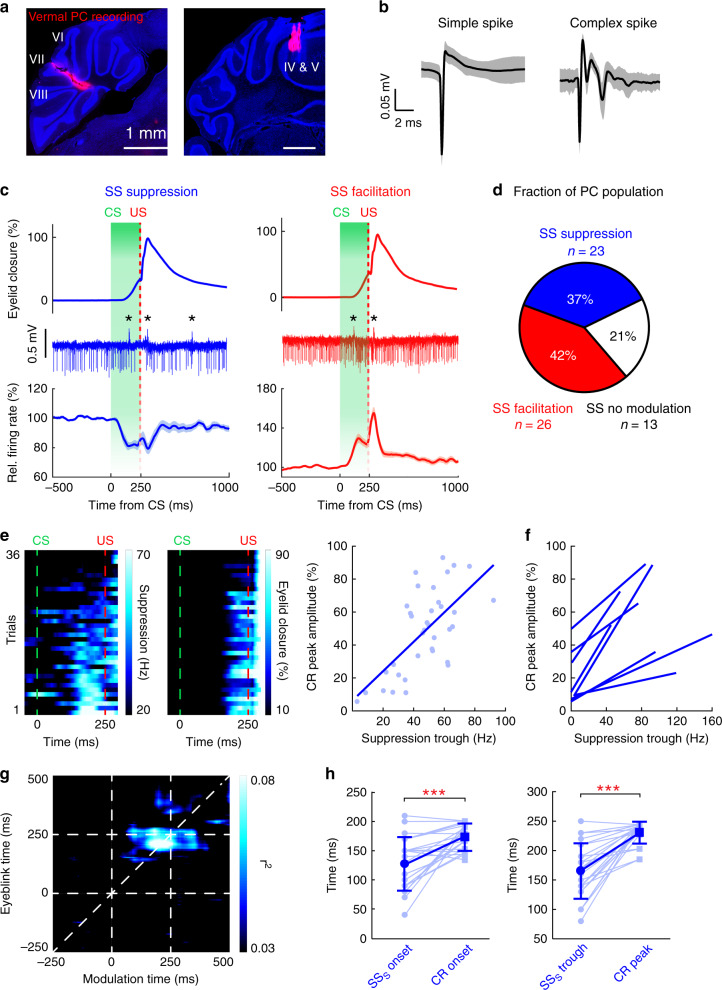
Fig. 3. Task-related simple spike modulation in vermal PCs.
a Representative DiI-labeled recording tracks in cerebellar vermal regions (lobules IV-VII). Scale bars, 1 mm. Experiments were performed with 17 mice. b Representative waveforms (mean ± coefficient of variation) of simple spikes and complex spikes from a single PC. c CS-related simple spike modulation in vermal PCs. Top and middle rows indicate example eyelid closure and spike traces of individual PCs (* indicates complex spikes); bottom: group average of simple spike activity from PCs of each modulation type (blue: PCs with simple spike suppression, n = 23; red: PCs with simple spike facilitation, n = 26/62), traces are plotted as mean ± s.e.m. d Fraction of PC population with simple spike modulations. e Example PC with a significant correlation between the simple spike suppression (left heatmap) and the CR peak amplitudes (right heatmap) over trials. Each row represents a single trial, ordered from bottom to top based on the magnitude of the simple spike suppression. The correlation of this cell is shown in the right panel (linear regression model, P = 1.24e−5), and each dot represents a single trial. f Summary of all PCs showing a significant trial-by-trial correlation between simple spike suppression and CR peak amplitude (linear regression model, P < 0.05, n = 8). g Average correlation matrix of 23 suppressed cells. Most-correlated epochs (bright pixels) are distributed across the diagonal line and before US delivery. CS and US onsets are denoted with dashed lines in both dimensions. h Comparison of the timing of simple spike suppression and behavior. Simple spike suppression precedes the CR both in onset (left, mean ± SD, n = 23, paired two-sided t test, ***P = 0.00013) and peak timing (right, mean ± SD, n = 23, paired two-sided t test, ***P = 1.94e−5).

