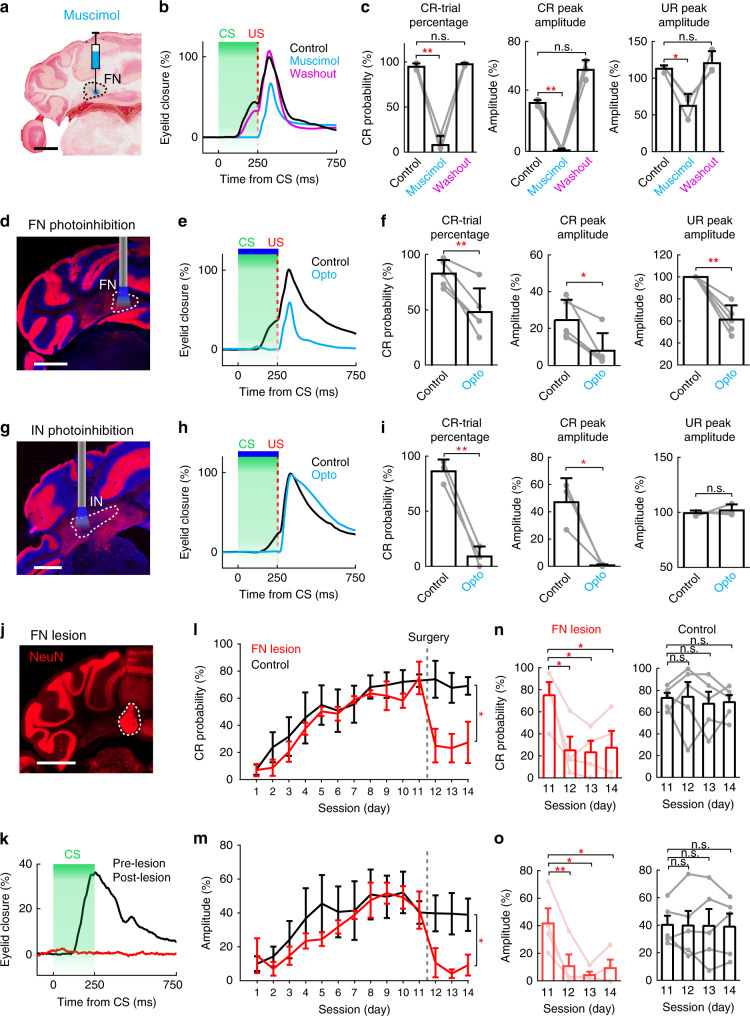
Fig. 5. Effects of transient and chronic FN perturbation on the expression of DEC.
a Example injection site of muscimol and alcian blue in the FN ipsilateral to the trained eye. Scale bar, 1 mm. b CR and UR performance of a mouse following muscimol inhibition of the FN. Average traces of eyelid movement, in control (black), by muscimol inhibition (cyan), and after washout (magenta) sessions from the same mouse. c Summary of the effects of muscimol inhibition on CR and UR performances (n = 3 mice, mean ± SD, paired two-sided t test, *P < 0.05, **P < 0.01). d Example cerebellar section showing exclusive expression of ChR2-tdTomato in the PCs of L7Cre-Ai27 mice. An optic fiber was implanted above the FN ipsilateral to the trained eye. Scale bar, 1 mm. e, f Same as (b, c), but for the optogenetic perturbation of FN neurons during the CS–US interval (indicated in blue bar). Both CRs and URs were suppressed (n = 5 mice, mean ± SD, paired two-sided t test, *P < 0.05, **P < 0.01). g–i Same as (d–f), but for optogenetic perturbation of the simplex lobule-IN module. CRs, but not URs, were suppressed (n = 3 mice, mean ± SD, paired two-sided t test, *P < 0.05, **P < 0.01). j Example image of cerebellar section after laser photolesion. Dashed contour highlights the strong autofluorescence from FN lesion site (n = 4 mice). Scale bar, 1 mm. k Representative CR traces from a trained mouse before (black) and after FN lesion (red). l Summary of CR-trial probabilities in the control (n = 5, mean ± s.e.m., black trace) and FN lesion groups (n = 4, mean ± s.e.m., red trace). CR-trial probability in lesion animals was lower than that of the control group (two-way repeated measures ANOVA, *P < 0.05). Dashed line indicates the time point for the photolesion. m Same as (l), but for the comparison of CR amplitudes in two groups. n Comparison of the CR-trial probability between the pre-lesion session (day 11) and 3 post-lesion sessions (days 12–14), in lesion group (red, n = 4, two-way repeated measures ANOVA, *P < 0.05) and control group (black, n = 5, paired two-sided t test, P > 0.05). Dots and lines indicate performance of different mice, mean ± s.e.m. o Same as (n), but for the comparison of CR amplitudes before and after lesion in the lesion group (n = 4, paired two-sided t test, *P < 0.05, **P < 0.01) and control group (n = 5, P > 0.05). See the exact P values for each comparison in the Source Data file.

