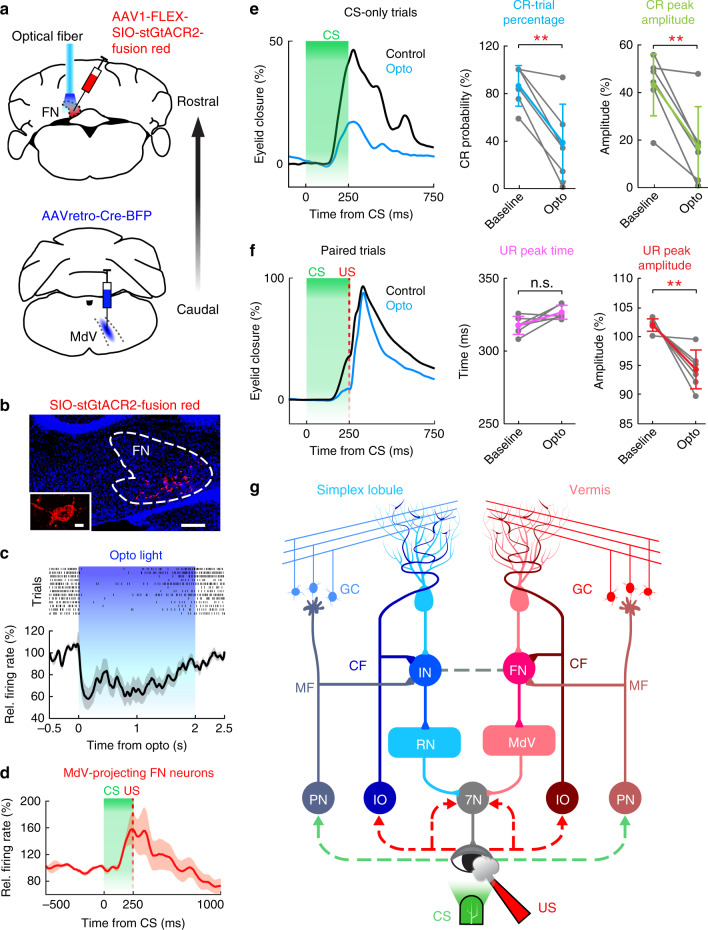
Fig. 9. Optogenetic suppression of the FN-MdV pathway affects CR and UR performance.
a Schematics showing viral injections and the optogenetic inhibition strategy to selectively identify MdV-projecting FN neurons and suppress the FN-MdV pathway during DEC. b Example image showing the somatic-targeting inhibitory opsin, stGtACR2, exclusively in FN neurons (insert). Scale bars, 200 µm, inserted image 10 µm, n = 6 mice. c FN neuron activity during optogenetic stimulation. Top: raster plot of an example neuron showing spike inhibition in response to optic light (n = 13 trials); bottom: average firing rate of all FN neurons in response to optic light (n = 15 neurons, mean ± s.e.m.). d Activity of the same photo-identified MdV-projecting FN neurons (n = 15 neurons, mean ± s.e.m.) in (c) during DEC. e, f Effects of optogenetic suppression of the FN-MdV pathway on behavior. Left column: average behavioral traces of an example mouse during CS-only trials (e) and CS–US paired trials (f). Middle and right columns: summary of behavioral performance. CR and UR amplitudes are significantly suppressed in trials with optogenetic perturbation (n = 6 mice, mean ± SD, paired two-sided t test, **P < 0.01), while UR timing is not influenced compared to control trials (n = 6 mice, mean ± SD, paired two-sided t test, P > 0.05). g Schematic drawing showing the proposed organization of the interposed nucleus (IN) and the fastigial nucleus (FN) pathways for DEC. Solid lines denote direct projections, and dashed lines indicate indirect innervations. Abbreviations: 7N, facial nuclei; CF, climbing fiber; GC, granule cell; IO, inferior olive; MdV, ventral medullary reticular nucleus; MF, mossy fiber; PN, pontine nuclei; RN, red nuclei. See the exact P values for each comparison in the Source Data file.

