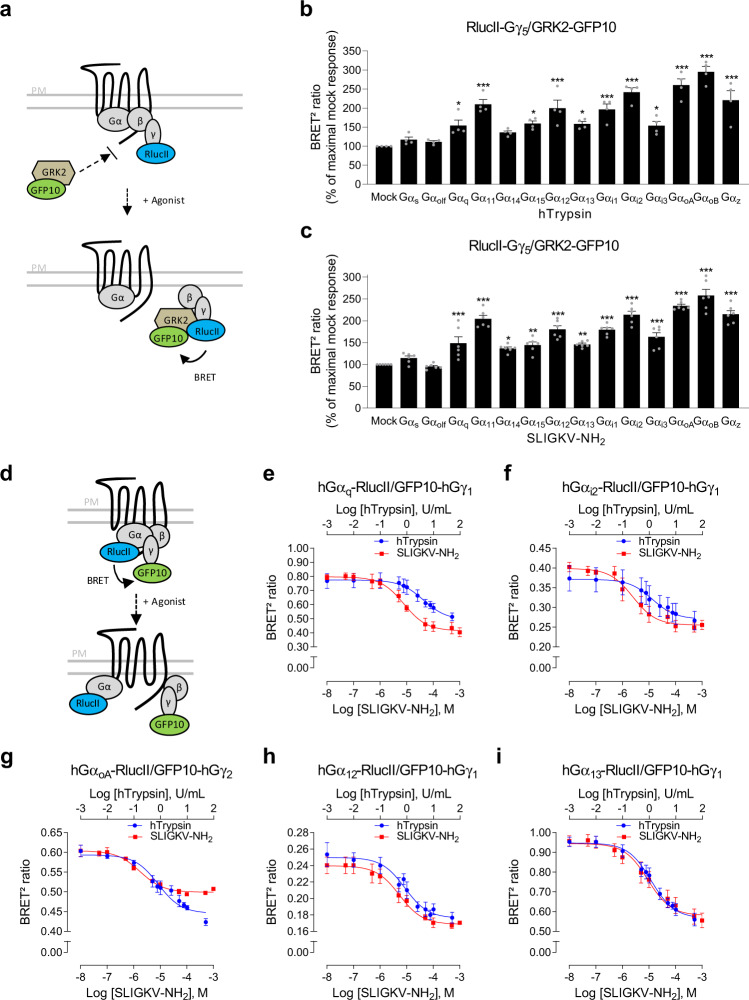
Fig. 1. G-protein activation profile of hPAR2 in response to hTrypsin and SLIGKV-NH2 in HEK293 cells.
a Schematic representation of the GRK-based BRET biosensor monitoring the activation of selective Gα subunits. Upon agonist stimulation, the Gα subunit dissociates from the βγ dimer (RlucII-Gγ5), allowing GRK2 sensor (GRK2-GFP10) recruitment to the βγ dimer and leading to an increase in BRET2 signal. b, c G-protein activation profiles induced by hTrypsin (10 U/mL, 15 min; b) or SLIGKV-NH2 (1 mM, 15 min; c) in HEK293 cells expressing hPAR2, and components of the G-protein activation sensor (RlucII-Gγ5, GRK2-GFP10, Gβ1, and the indicated Gα subunit). Results are expressed as BRET2 ratio in % of maximal response obtained in mock condition (mean ± SEM; n = 4–6; one-way ANOVA followed by Dunnett’s post hoc: *p < 0.05, **p < 0.01, and ***p < 0.001 compared to mock condition). d Schematic representation of the BRET2-based biosensor monitoring the agonist-promoted Gα and Gγ subunit separation. Upon agonist stimulation, the Gα subunit (Gα-RlucII) dissociates from the βγ dimer (GFP10-Gγ), leading to a decrease in BRET2 signal. e–i Dose–response curves of G-protein activation induced by increasing concentrations of hTrypsin or SLIGKV-NH2 (1 min) in HEK293 cells expressing hPAR2, Gβ1, and the BRET2-based α/βγ dissociation biosensors (GFP10-Gγ1 (e, f, h, i) or GFP10-Gγ2 (g) along with the indicated Gα-RlucII subunit). Results are expressed as BRET2 ratio of absolute values (mean ± SEM; n = 3).

