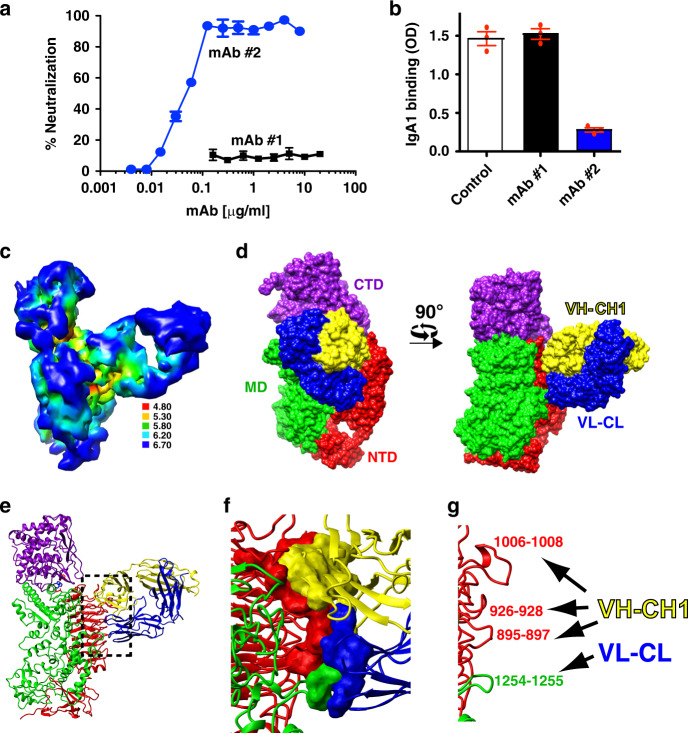
Fig. 4. Cryo-EM structure of an S. pneumoniae IgA1P/mAb complex.
a ELISA-based neutralization assay comparing the blocking activity of two mAbs produced against IgA1P to cleave IgA1. The mAb #1 (black) previously developed does not neutralize IgA1P activity21 and the currently characterized mAb #2 (blue) does neutralize IgA1P activity. IgA1P residues 154–1963 was incubated at 286 ng/ml (1.3 nM) with varying concentrations of the mAbs. For reference, 1 μg/ml of each mAb is approximately 6.7 nM estimating the molecular weight as 150 kDa. Data are an average of n = 4 biological replicates with the standard error of the mean also shown. b S. pneumoniae IgA1P-E1605A binds to IgA1 (white), which is not blocked by mAb #1 (black) but is blocked by mAb #2 (blue). IgA1P-E1605A was plated at 1 μg/ml and incubated with either buffer or 2 μg/ml mAb. Data are an average of n = 3 biological replicates shown as a dot blot along with the standard error of the mean also shown. c 3D reconstruction of the S. pneumoniae IgA1P in complex with IgA1 colored according to local resolution estimates (units in Å). d Surface representation of the IgA1P/mAb complex (PDB ID: 7JGJ) with IgA1P shown in a similar orientation as Fig. 1 (left) and rotated 90° (right). The complex comprises IgA1P (colored as in Fig. 1) and both the mAb VL-CL (blue) and mAb VH-CH1 (yellow). e Ribbon structure of the IgA1P/mAb complex with the box highlighting the interaction regions. f Expansion of the interaction site with residues that form a contact surface within 3 Å shown. g Specific interacting loops of IgA1P targeted by the mAb are shown. Source data for panels a and b are provided as a Source Data File.

