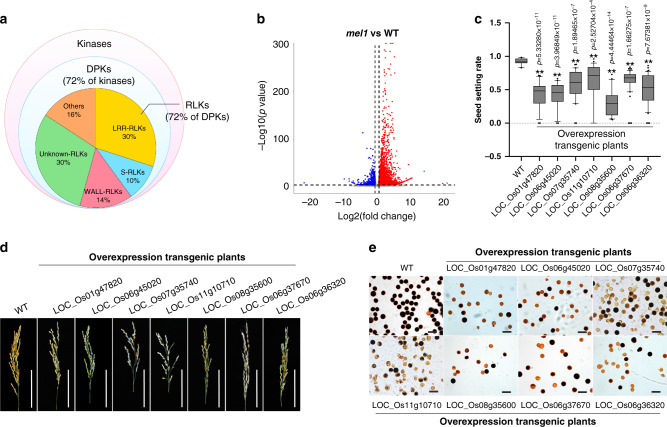
Fig. 2. Reproductive phasiRNA target genes that negatively regulate sporogenesis.
a Pie charts showing the categories of the kinases targeted by reproductive phasiRNAs. b Volcano plots of the global gene expression pattern in mel1 and wild-type (WT) spikelets at the PPS. Red spots represent genes that upregulated in mel1, and blue spots represent genes that downregulated in mel1. c Seed-setting rate of WT and different transgenic plants. Each target gene was overexpressed independently. Box plots indicate median (middle line), 25th, 75th percentile (box) and 10th and 90th percentile (whiskers) as well as outliers (single points). (n = 15, 23, 20, 38, 26, 23, 50, and 42 plants from left to right, respectively). Significant differences were identified at the 5% (*) and 1% (**) probability levels using two-tailed paired t-test. d Panicles of WT and different transgenic plants. Scale bars = 10 cm. e Pollen grains stained with iodine-potassium iodide of the WT and different transgenic plants. Scale bars = 100 µm. n = 3 independent replicates.

