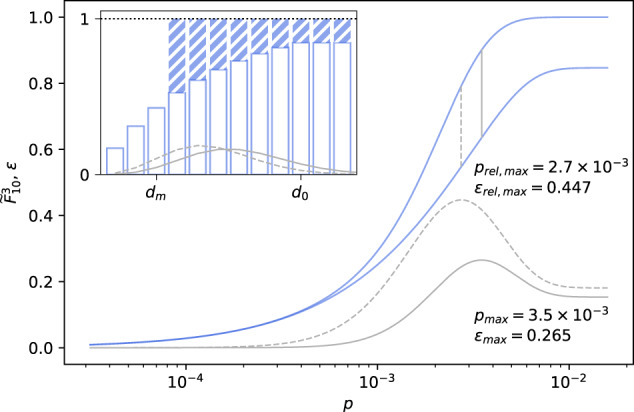
Fig. 2. Maximum error of .

Lower () and upper () bounds (blue lines) as well as relative and absolute errors (dashed and solid grey lines) for the PoF of a GSMM of E. coli with dm = 3 and d0 = 10 vs. LOF mutation rate p. Vertical grey lines indicate the position of the respective maximum value. The inset shows fd for 1 ≤ d ≤ 12 (white bars) and the corresponding maximum error (blue bars) as well as the shape of the binomial distribution at the mutation rates with the greatest absolute and relative errors.
