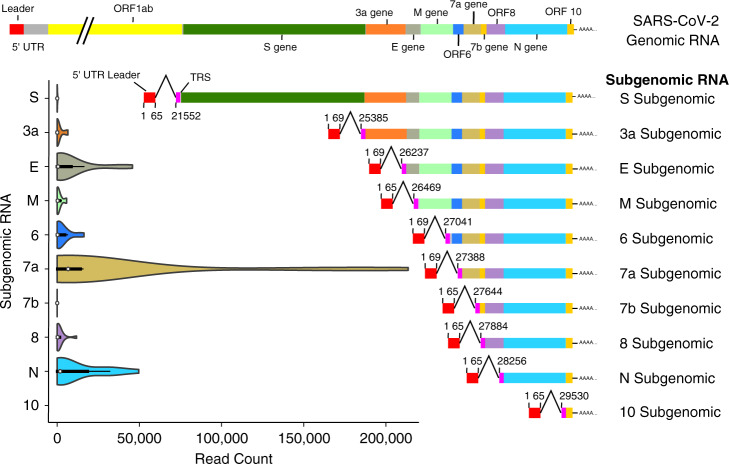
Fig. 1. SARS-CoV-2 genomic and subgenomic RNA structure showing genes and open reading frames (ORF) together with violin plots showing the number of reads per total of 5 million reads in the diagnostic samples mapped to the leader-containing subgenomic RNAs in the fasta file used for mapping.
The median read count is indicated by the white dot, the interquartile range (IQR) by the thick bar, and the furthest values within 1.5*IQR indicated by the thin black line (n = 14 data points from 12 biological samples from eight individuals run once). The structure of the SARS-CoV-2 genomic RNA is shown at the top and each subgenomic RNA is illustrated next to the respective violin plot. The nucleotide positions for the leader-TRS (transcription-regulatory sequences) joining locations are indicated alongside each subgenomic RNA (numbering based on reference Wuhan-Hu-1 NC_045512.2/MN908947.3 [https://www.ncbi.nlm.nih.gov/nuccore/NC_045512.2/ and https://www.ncbi.nlm.nih.gov/nuccore/MN908947.3]). In the current study no reads mapped to the tentative Orf10 leader-containing subgenomic RNA.

