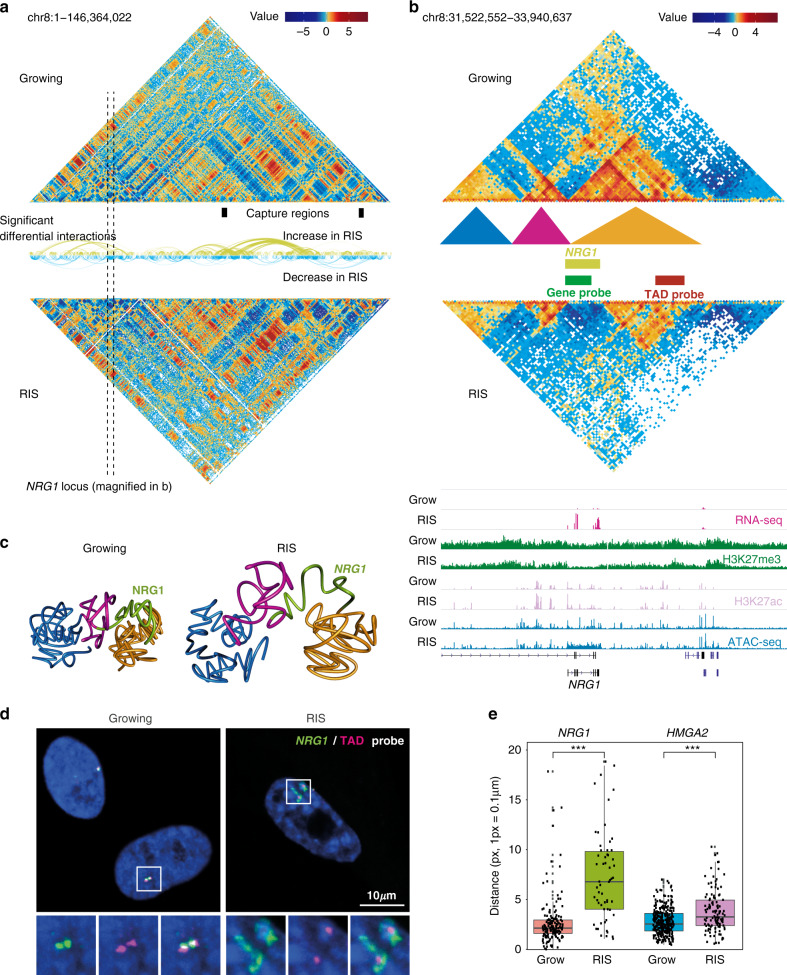
Fig. 1. Changes in chromatin interactions during RIS.
a Hi-C matrices (300 kb resolution) of chromosome 8 in Growing and RIS cells (all available replicates were aggregated per condition as described in the Data visualization methods section); arcs represent significant interaction changes (100 kb resolution, determined genome-wide with only chromosome 8 shown here as an example); black boxes represent captured regions. b Hi-C interaction matrices at the NRG1 locus, as marked by the dotted lines in (a), at 20 kb resolution, with TADs represented by coloured triangles (called at 40 kb resolution), as well as matching tracks for RNA-seq, ChIP-seq, and ATAC-seq (normalized and input-subtracted using THOR62). c Three-dimensional interaction modelling with TADbit at the NRG1 locus in Growing and RIS, including NRG1 (green) and surrounding TADs marked in (b). d Representative DNA-FISH images in growing and RIS cells, using the FISH probes corresponding to the NRG1 locus (gene-probe, green) and nearby H3K27me3 region within the same TAD (TAD-probe, magenta), as marked in (b). Regions indicated by rectangles are magnified, showing two gene-TAD pairs in each condition. e Quantification of the average distance per cell between the gene-probe and the TAD-probe in growing and RIS cells, where each dot corresponds to one cell (n = 159, 58, 321, and 116, respectively, from left to right, cells examined in two experiments consisting of growing and RIS conditions). Significance testing was performed using two-sided t-tests: ***p ≤ 0.001 (left: p = 3.721e–10, right: p = 9.195e−07). Box plots correspond to the median, 25th to 75th percentiles, and the whiskers correspond to the 10th to 90th percentiles.

