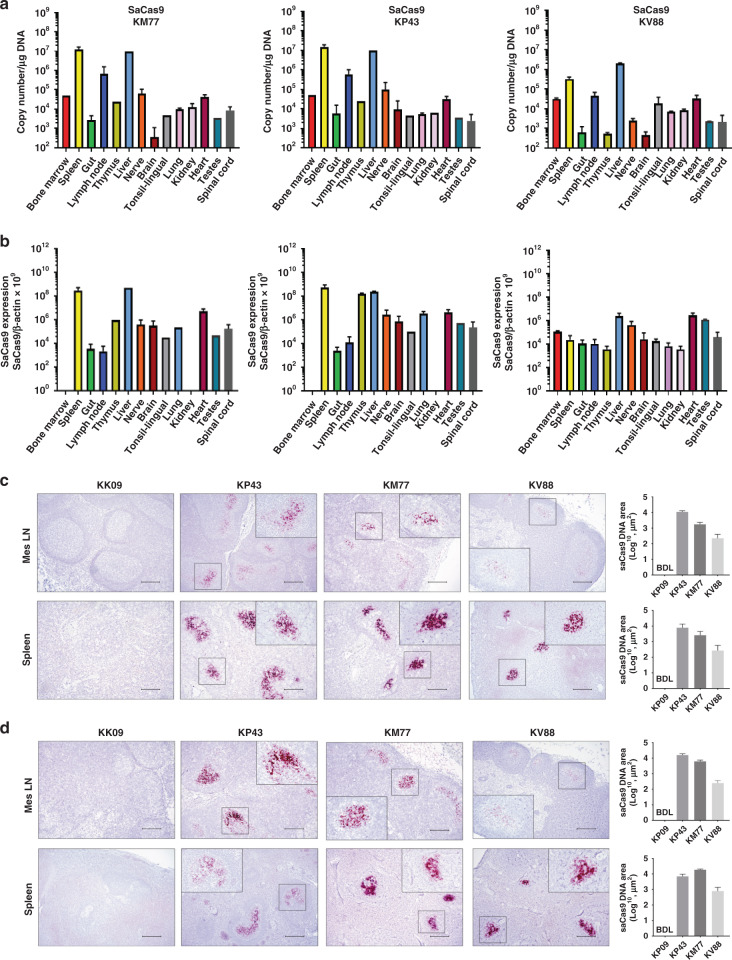
Fig. 3. Biodistribution of CRISPR-Cas9 vector in tissues.
a ddPCR analysis of Cas9 transgene DNA levels in genomic DNA extracted from various tissues of AAV9-CRISPR-SIV-treated animals (KM77, KP43 and KV88). b Detection of Cas9 RNA as a ratio to β-actin in various tissues of three animals i.v. inoculated with AAV9-CRISPR. Fifty nanograms of cDNA was analyzed in each reaction well for measuring the expression of SaCas9. β-Actin as reference gene for copy number reference reactions. Data in panels (a) and (b) are shown as mean ± SEM. Number of samples for each tissue is as follows: n = 1 for liver, tonsil and bone marrow; n = 12 for gut; n = 8 for lymph node; n = 6 for spinal cord; n = 9 for brain; n = 3 for spleen; n = 4 for heart; n = 2 for nerve, kidney, and lung. All samples were run in duplicate. c Using DNAScope technology, Cas9 DNA was detected in the mesenteric lymph nodes and spleens of SIV-infected ART-treated rhesus macaques with in vivo AAV-9-CRISPR administration (KP43, KM77 and KV88), but not in the animal without in vivo AAV-9-CRISPR (KK09). Cas9 DNA was quantified using Keyence BZ-X700 Microscope and accompanying Batch Analysis Software to determine the average area of positive signal from 30 nonoverlapping ×10 images. Data are presented as mean values of the 30 counts ±SEM. Representative images are ×10 with inserts at ×40 magnification. BDL below detection limit. d Cas9 RNA in tissues from rhesus macaques treated with AAV9-CRISPR in vivo. Using RNAScope technology, Cas9 RNA was detected in the mesenteric lymph nodes (Mes LN) and spleens of SIV-infected ART-treated rhesus macaques with in vivo AAV-9-CRISPR administration (KP43, KM77 and KV88), but not in the animal without in vivo AAV-9-CRISPR (KK09). Cas9 RNA was quantified using Keyence BZ-X700 Microscope and accompanying Batch Analysis Software to determine the average area of positive signal from 30 nonoverlapping ×10 images. Data are presented as mean values of the 30 counts ±SEM. Representative images are ×10 with inserts at ×40 magnification. BDL below detection limit. Scale bar = 200 μm Source data are provided as a Source Data file.

