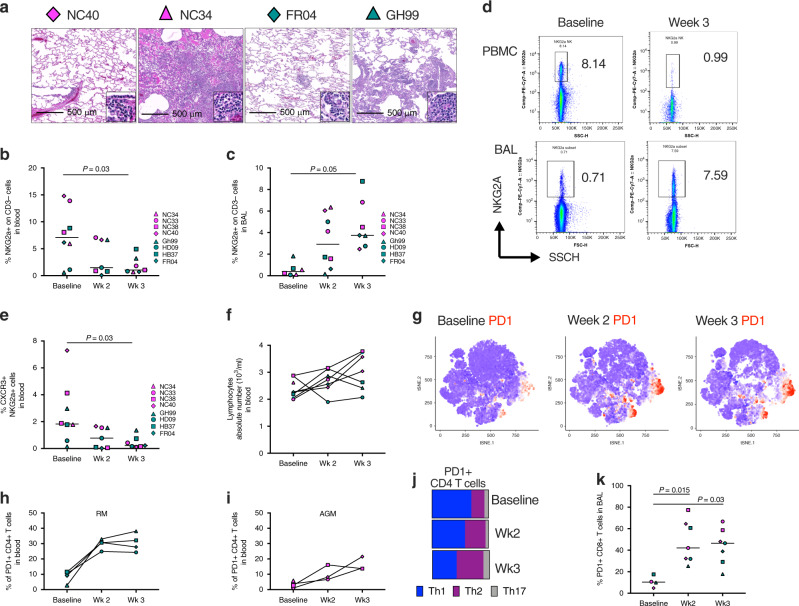
Fig. 5. Lymphocytes infiltration in the lungs is associated with disease severity.
a Histopathologic findings showing infiltration of lymphocytes in the lung of AGM (NC40 and NC34) and RM (FR04 and GH99) with mild (NC40 and FR04), moderate (GH99), and severe disease (NC34). b Frequency of NKG2a+ cells in the blood or c BAL of 4 AGM and 4 RM at baseline, 2 weeks and 3 weeks post SARS-CoV-2 infection by flow cytometry. d Representative flow cytometry plot showing a decreased frequency of NGK2a+ cells in PBMCs and increased frequency in BAL to baseline in at week 3 post-SARS-CoV-2 infection respect to baseline. One animal for each species is shown. e Decrease in the frequency of CXCR3+ NKG2a+ cells in the blood at 2 weeks and 3 weeks post SARS-CoV-2 infection compared to the baseline. f Absolute number of lymphocytes before and after infection. g tSNE plots displaying kinetics of PD-1 expression (in red) on lymphocytic cell populations over time. h Frequency of PD-1+ Th2 (CXCR3− CCR6−) CD4+ T cells is increased in RM and i in AGM overtime following the infection. j Changes in the percentage of Th2 (purple), Th1 (blue) and Th17 (gray) cells within the total PD-1+ CD4+ T cell population. k Significant increase in the percentage of PD-1+ CD8+ T cells in BAL. Analysis of variance (ANOVA) was used for comparing statistical differences between multiple groups, followed by Dunn’s multiple comparison tests for b, c, and k.

