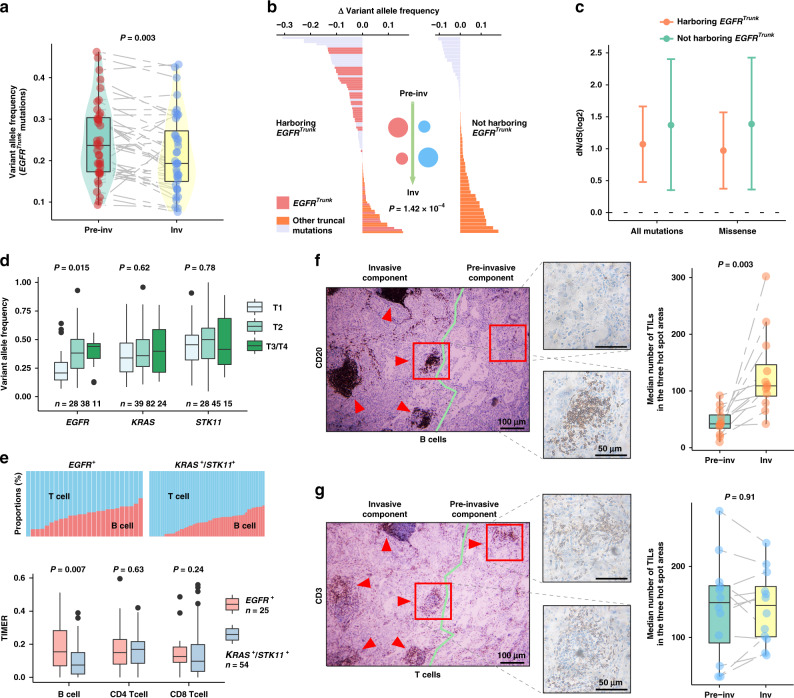
Fig. 4. Strong selective pressure derived from B cell infiltration in MPNs harboring truncal EGFR mutation.
a Variant allele frequency (VAF) of identified truncal EGFR mutations in 36 paired pre-invasive and adjacent invasive components. Differences were assessed using the two-sided Wilcoxon rank-sum test. b Mutant abundance change of identified truncal mutations between two components in EM2, according to whether they harbored truncal EGFR mutations. Red and blue circles represent the putative truncal clone abundance of two groups during the invasive progression, respectively. P value was derived from two-sided Wilcoxon rank-sum test. c The dN/dS ratios inferred for 36 MPNs harboring and 11 MPNs not harboring truncal EGFR mutations. These ratios were obtained as described for Fig. 3b. Circles and vertical lines correspond to the mean and 95% confidence intervals of the dN/dS ratio, respectively. d Mutation abundance in EGFR, KRAS, and STK11 mutations in the TCGA LUAD data for patients of stages T1–4. Differences among stages were assessed by Kruskal–Wallis H test. e Comparisons of T cells and B cells between EGFR- and KRAS/STK11-mutated groups using TIMER inflammatory infiltration in T1 stage cases of TCGA. P value, two-sided Wilcoxon rank-sum test. f, g Representative sliced IHC images of B cells f and T cells g in 12 EGFR-mutated patients. Two-sided Wilcoxon rank-sum test was used for paired invasive and pre-invasive components. Bar, median; box, 25th–75th percentiles (interquartile range, IQR); vertical line, data within 1.5 times the IQR. Inv Invasive and Pre-inv Pre-invasive.

