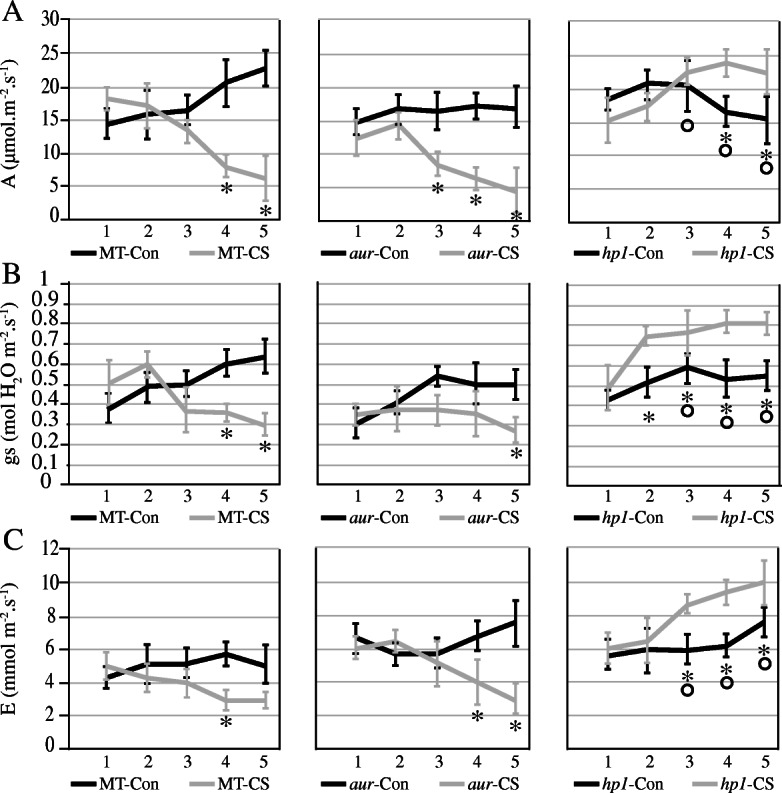
Fig. 1.

Effects of chilling stress on gas exchange parameters. a Photosynthetic rate denoted as A and measured in μmol m−2 s−1, b stomatal conductance denoted as gs and calculated in mol H2O m−2 s−1, and c transpiration rate denoted as E and calculated in mmol m−2 s−1. Samples were obtained from leaves of wild-type genotype (MT) and aurea (aur) and high pigment1 (hp1) mutants of tomato cv. Micro-Tom. Blue lines indicate the effects on plants under control (Con) conditions whereas green lines show effects after chilling stress (CS). The data were collected and compared for each day until 5 days under chilling stress. Symbols that are not similar show significant differences (calculated by Tukey’s test, P < 0.05). Comparisons between the control and stress treatments within the same genotype were indicated as asterisks, whereas circles were used for comparisons among genotypes under the stress treatment
