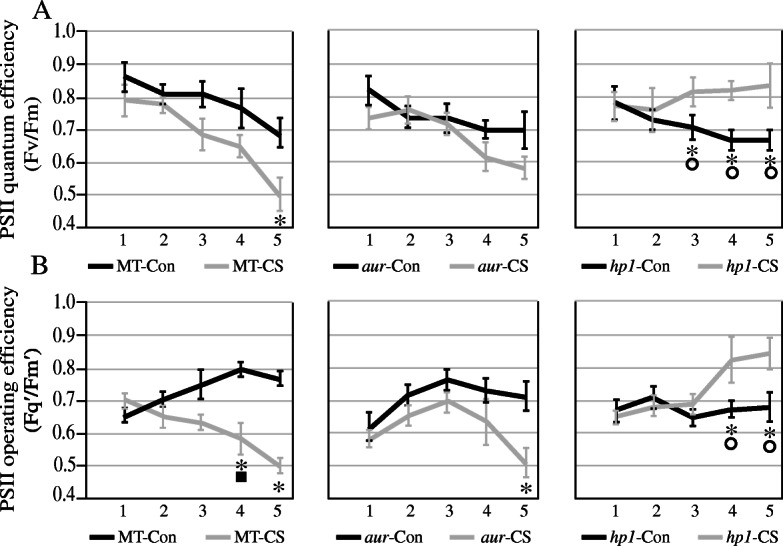
Fig. 3.

Comparison of a PSII potential quantum efficiency (Fv/Fm) and b PSII operating efficiency (Fq′/Fm′) in leaves of the wild-type genotype (MT) and aurea (au) and high pigment1 (hp1) mutants of tomato cv. Micro-Tom under control (Con) and chilling stress (CS) for 5 days. Blue lines represent data for control and green lines show data for stress treatment. Symbols that are not similar show significant differences (calculated by Tukey’s test, P < 0.05). Comparisons between the control and stress treatments within the same genotype were indicated as asterisks, whereas solid squares represent comparisons among genotypes under the control treatment and circles were used for comparisons among genotypes under the stress treatment
