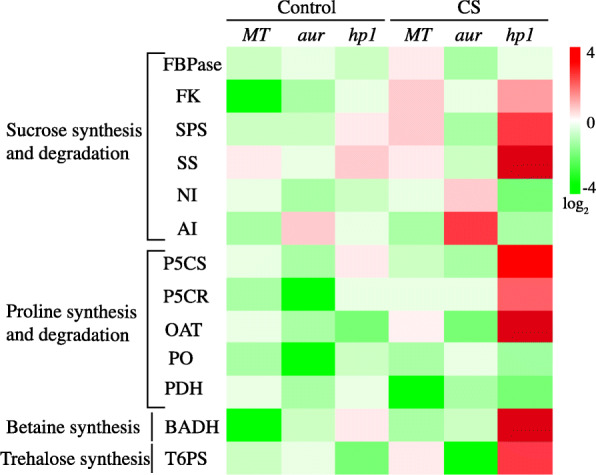
Fig. 7.

Heat map of a selected set of enzymes related to the different osmolytes biosynthetic pathways (synthesis and degradation). The enzyme activities were measured in in leaves from wild-type genotype (MT) and aurea (aur) and high pigment1 (hp1) mutants of tomato under control and chilling stress (CS) conditions. Red color represents higher relative activity and yellow color represents lower relative activity. Scale is the log2 of the mean concentration values after normalization (n = 10). The data is representative of two independent experiments
