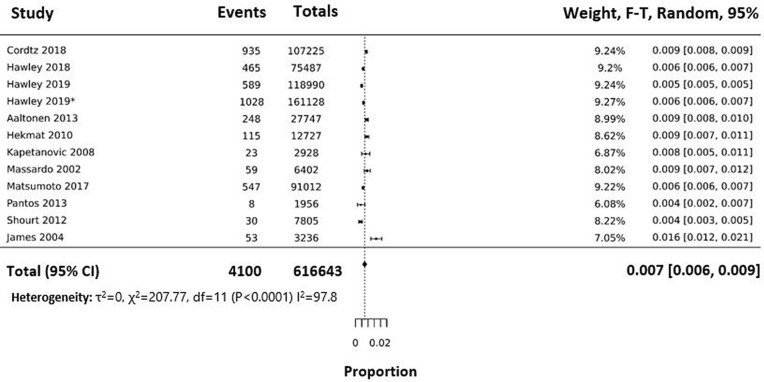
Fig. 2.
Forest plot representing the distribution of the studies analysed for the incidence of THA in patients with RA. Events are the numbers of THA occurring in patients with RA in each study, while the total is the number of PY observed. The dotted line represents the mean effect, where mean and confidence intervals of each of study are represented by the box and whiskers. The total effect is represented by the diamond at the bottom. Rates in the right-hand column are quoted in THA per single PY

