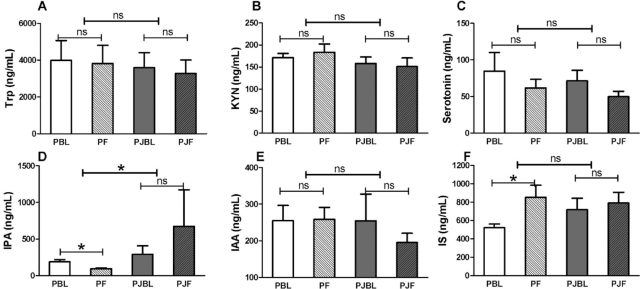
FIGURE 1.
Human plasma Trp and its major metabolites at baseline and after 1 y of PomJ or PL intake. (A) Trp, (B) KYN, (C) serotonin, (D) IPA, (E) IAA, and (F) IS concentrations. Data are presented as means ± SEMs (PomJ, n = 11; PL, n = 8). Within-group changes were analyzed by Wilcoxon signed ranks test (light capped line; PBL vs. PF; PJBL vs. PJF). Mann–Whitney test was used to see if the changes of Trp metabolites in the 2 groups are different (bold capped line; PL vs. PomJ). *Significantly different, P < 0.05. IAA, indole acetate; IPA, indole propionate; IS, indole sulfate; KYN, kynurenine; ns, nonsignficant; PBL, placebo baseline; PF, placebo final; PJBL, PomJ baseline; PJF, PomJ final; PL, placebo; PomJ, pomegranate juice.

