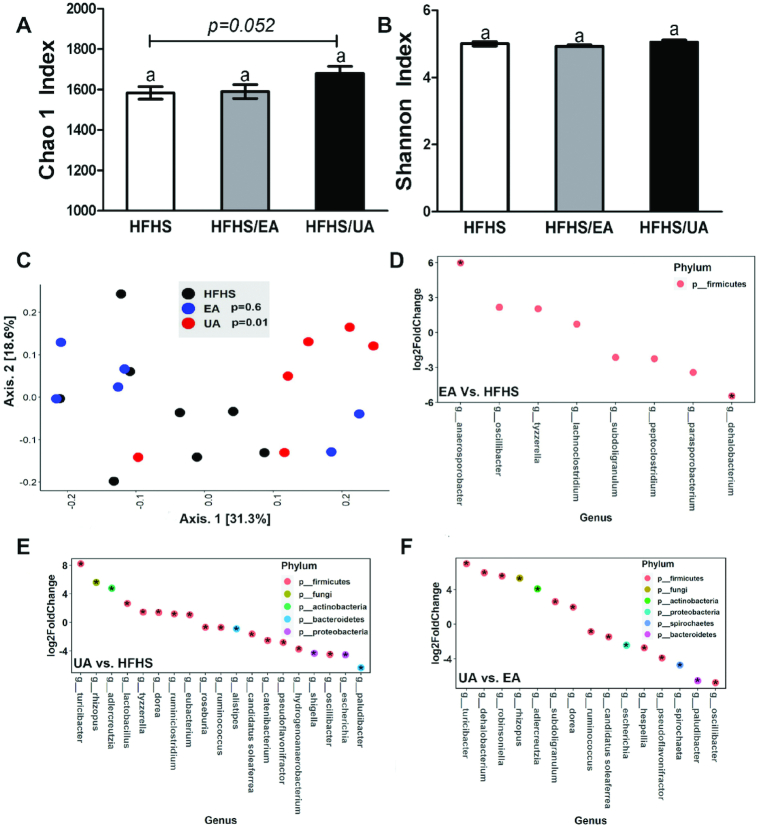
FIGURE 6.
Effects of dietary EA and UA supplementation on gut microbiota. α-Diversity indexes (A) Chao1 and (B) Shannon in experimental mice fed for 8 wk with HFHS diet or HFHS diets supplemented with EA or UA. Data are presented as means ± SEMs (HFHS, n = 8; HFHS/EA, n = 6; HFHS/UA, n = 6). Labeled means without a common letter differ, P < 0.05. (C) Principal coordinate analysis plot of β-diversity measure Bray–Curtis dissimilarity. Differential abundance analyses at genus level were performed between (D) EA vs. HFHS, (E) UA vs. HFHS, and (F) UA vs. EA (P < 0.05, *adjusted P < 0.2). Data plotted as log2-fold change. EA, ellagic acid; HFHS, high-fat/high-sucrose; UA, urolithin A.

