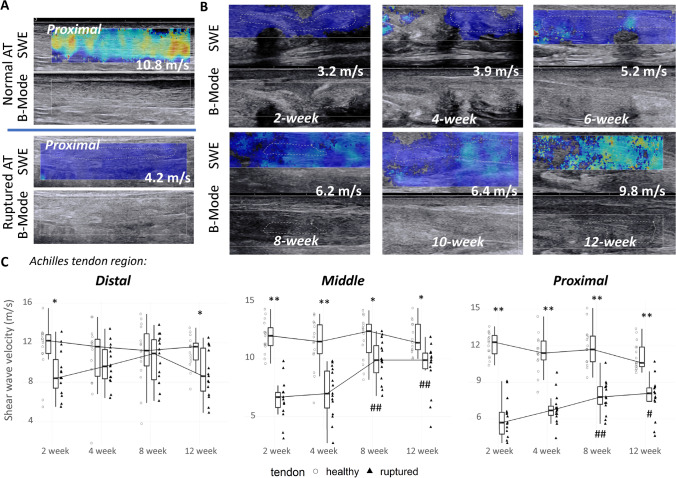
Figure 3.
(A) Examples of tendon stiffness maps and corresponding B-mode images from the proximal region of injured and contralateral healthy AT of a patient two weeks after the rupture. SWE color maps are coded from blue to red, indicating low to high tissue stiffness. Note the low shear wave velocity values (ie, low stiffness) measured in the injured Achilles tendon. (B) SWE maps from a patient AT indicating a progressive increase in shear wave velocity over the 3-month observation period after the rupture. (C) Average time-course recovery of the injured AT showing approximately 65% recovery in tendon stiffness until 12 weeks after the injury. Values in the boxplots (N = 15/timepoint) are medians ± 1.5*Interquartile Range (IQR). *p < .05, **p < .0001 vs injured tendon; #p < .05, ##p < .0001 vs baseline in the injured tendon.

