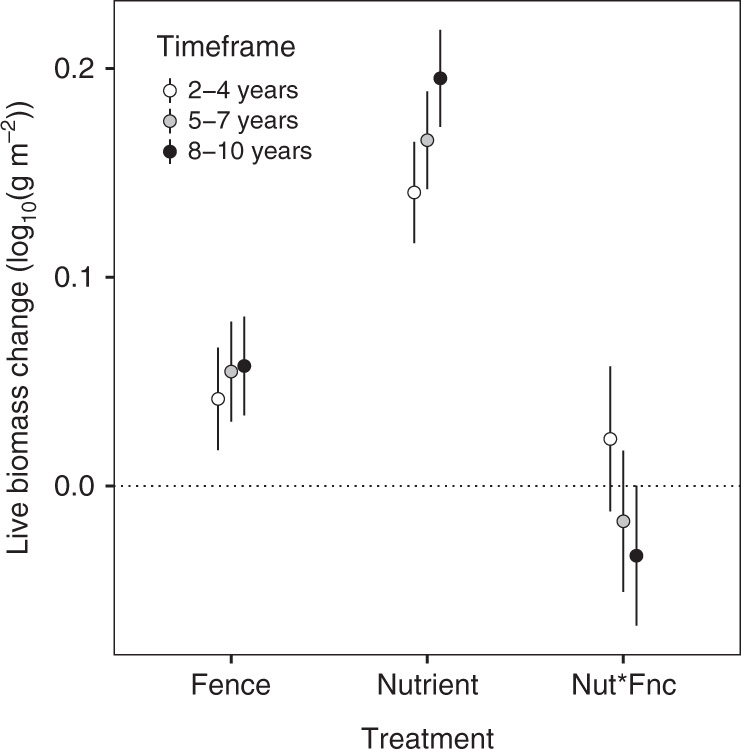
Fig. 2. Treatment effects on aboveground grassland biomass were similar for sites with 2–4 years of response data (n = 58, open circles), at least 5 years (n = 42, gray), and at least 8 years (n = 24, black).

Error bars represent 95% confidence intervals. Main effect values represent model mean differences of the experimental treatment from the control after controlling for site and year as random effects. The nutrient by fence interaction (“Nut*Fnc”) is compared to the sum of the effect of nutrients alone and fencing alone, such that zero indicates additivity.
