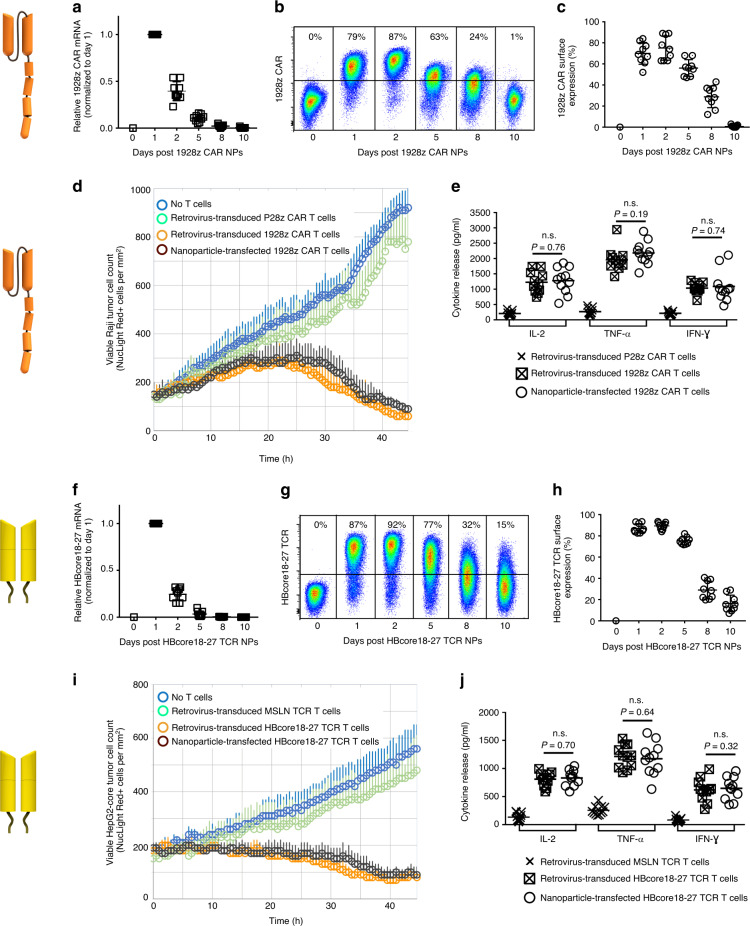
Fig. 3. IVT mRNA nanocarriers efficiently transfect human T cells with CAR or TCR transgenes.
Isolated human CD8+ T cells were stimulated with beads that are coated with antibodies against TCR/CD3 and co-stimulatory CD28 receptors. Twenty-four hours later, beads were removed and CD8-targeted nanoparticles (NPs) containing either mRNA encoding the leukemia-specific 1928z CAR (a–e) or the HBcore18-27 TCR (f–j) were mixed into the cell suspension at a concentration of 3 µg of mRNA/106 cells. a qPCR measurements of relative 1928z CAR mRNA expression over time after T cells were exposed to 1928z CAR NPs. Shown are mean values ± SD. N = 9 biologically independent samples. b Flow cytometry of T cells at the indicated time points after incubation with NPs bearing 1928z CAR-encoding mRNA. c Summary plot of in vitro gene transfer efficiencies. Shown are mean values ± SD. N = 9 biologically independent samples. d In vitro assay comparing cytotoxicity of nanoparticle-transfected vs. retrovirus-transfected T cells against Raji lymphoma cells. T cells were co-cultured with Raji tumor cells at a 5:1 ratio. We used the IncuCyte Live Cell Analysis System to quantify immune cell killing of Raji NucLight Red cells by 1928z-CAR or control (P28z-CAR)-transfected T cells over time. Data are representative of two independent experiments. Each point represents the mean ± s.e.m. pooled from two independent experiments conducted in triplicate. e ELISA measurements of IL-2 (at 24 h) and TNF-α and IFN-γ (at 48 h) secretion by transfected cells. Shown are mean values ± SD; two tailed unpaired Student’s t-test. N = 9 biologically independent samples. f qPCR measurements of relative HBcore18-27 TCR mRNA expression over time after T cells were exposed to HBcore18-27 TCR NPs. Shown are mean values ± SD. N = 9 biologically independent samples. g, h Gene transfer efficiencies. i Cell killing of HepG2-core NucLight Red cells by HBcore18-27 or control (MSLN-) TCR-transfected T cells over time. T cells were co-cultured with HepG2 tumor cells at a 5:1 ratio. N = 9 biologically independent samples. j ELISA measurements of cytokine secretion by transfected cells. Shown are mean values ± SD; two tailed unpaired Student’s t-test.

