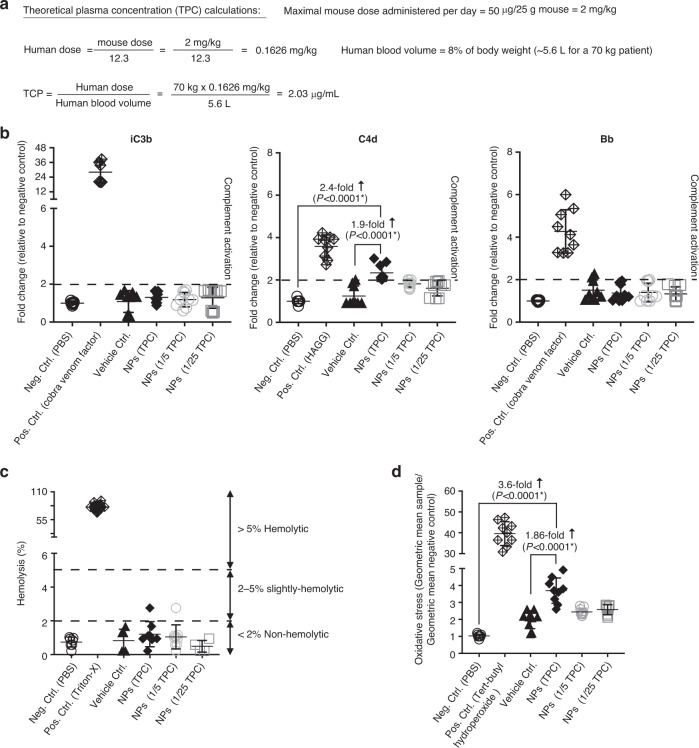
Fig. 9. In vitro analysis of possible infusion reactions.
a Calculation of the theoretical plasma concentration. b Hemolytic activity of T-cell-targeted mRNA nanoparticles (NPs). c Quantitative determination of complement activation by an Enzyme Immunoassay. A 2-fold change relative to the negative PBS control was defined as the assay threshold (dashed line). d Mitochondrial oxidative stress in lymphocytes following NP transfection. In all panels of this figure, N = 9 biologically independent blood samples were analyzed. Also shown are the mean values ± SD. Pairwise differences between groups were analyzed by two tailed unpaired Student’s t-test.

