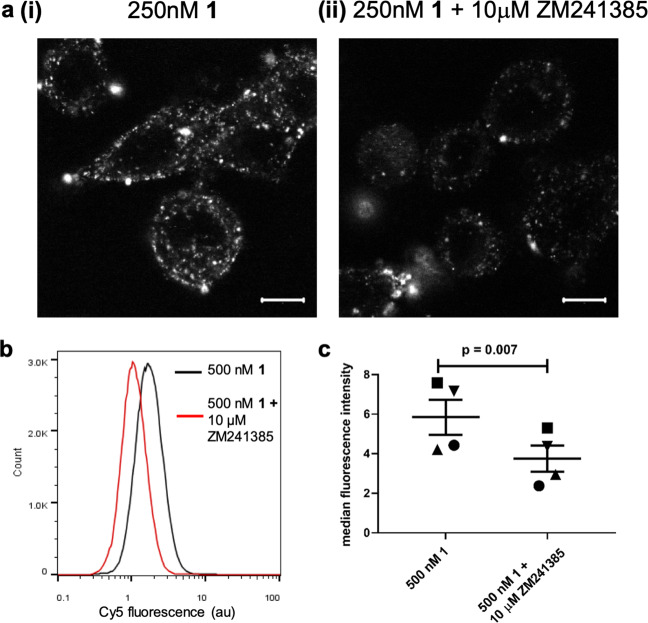
Fig. 4. Labelling of endogenously expressed A2AR by 1.
a SK-BR-3 cells were labelled with 250 nM 1 in the (ii) presence or (i) absence of 10 µM ZM241385 for 2 h prior to the capture of single equatorial confocal images. Images shown are representative of images taken in three independent experiments, with all image sets taken using identical settings for laser power, gain, and offset in both channels. Scale bar shown represents 10 µm. b Representative flow cytometry histograph of human macrophages treated with 500 nM 1 (black line) or 500 nM 1 plus 10 μM ZM241385 (red line) for 2 h at 37 °C. c Median fluorescence intensity of macrophages derived from four healthy donors treated as in b (p = 0.007, paired t-test). Each symbol represents one donor and line shows mean with s.e.m.

