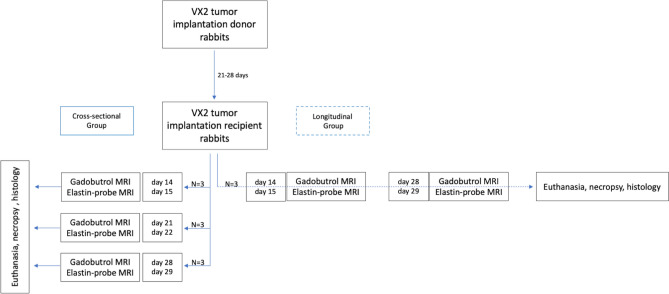
Figure 5.
Experimental in vivo study design. In the vertical direction, the flow chart illustrates the VX2 rabbit tumor model and multimodal imaging on sequential time points. Left column: groups of three tumor-bearing rabbits were assigned to one MRI time point (day 14 + 15, 21 + 22, and 28 + 29 after tumor implantation) and euthanized following the scan. Right column: a group of three rabbits was assigned to two longitudinal MRI scans at each time point (14 + 15 and 28 + 29 days) and euthanized following the scan at time point 29.

