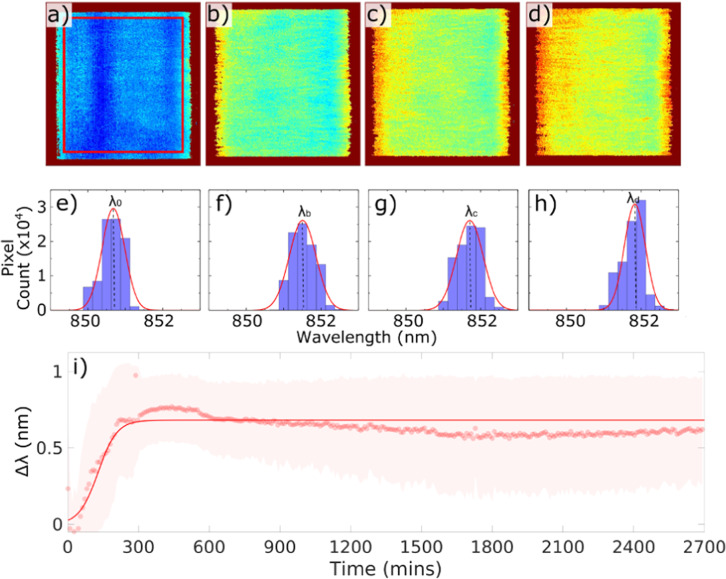
Fig. 2. Hyperspectral images and resonance wavelength shifts.
a–d Hyperspectral images generated by the biofilm sensor at times 0, 2, 3.5 and 6 h from the start of the experiment. The colour represents the resonance wavelength; e–h histogram data of resonance wavelengths of all pixels in a–d correspondingly, and Gaussian fit (red curve) to determine the central wavelength: λ0 (at 0 h), λb (at 2 h), λc (at 3.5 h) and λd (at 6 h); i plot of the resonance wavelength shift, Δλ (Δλ = λn–λi), against time (dots represent the central resonance wavelength λn from each Gaussian fit; shaded areas illustrate standard deviations of corresponding Gaussian fits and delineates the distribution of the resonance wavelengths of all 200 x 200 pixels) and the solid line is a sigmoidal fit to the data. λi is defined as the base value of the resonance wavelength, averaged over the first 30 min after the flow of culture is started. Data showing long term (45 h) stability of the biofilm sensor with fresh LB media introduced into the flow cell at 24 h. The initial E. coli concentration used here is 2 × 10⁸ CFU per mL.

