
Fig. 3. Biofilm formation time as a function of E. coli concentration.
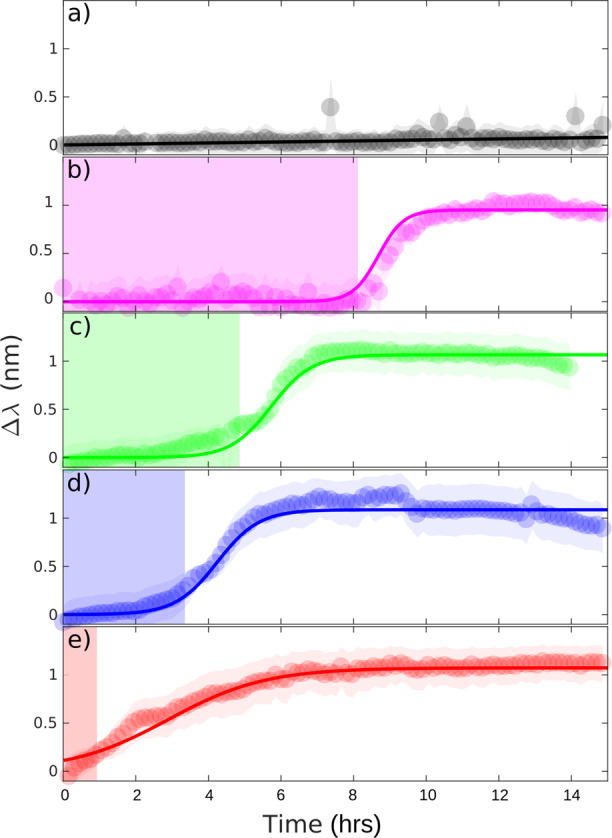
a LB broth only, for reference. Concentrations of (b) 2 × 10⁵, (c) 2 × 10⁶, (d) 2 × 10⁷, (e) 2 × 10⁸ CFU per mL in LB. At least three independent replicates were performed for each concentration and reference. The solid lines are sigmoidal fits to the data and the fitting parameters are presented in Table 1. The shaded region indicates the duration of the reversible cell attachment, tplank.