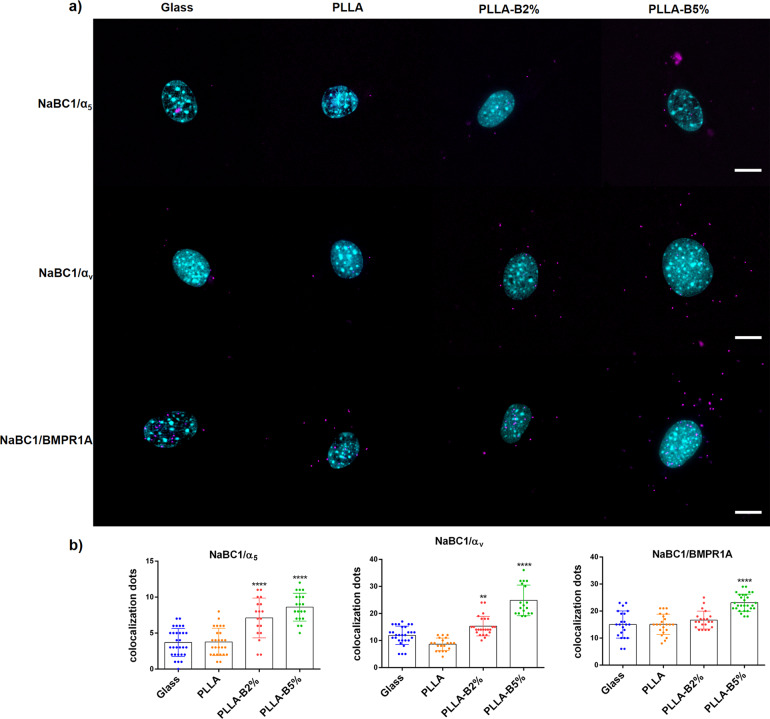
Fig. 3. NaBC1/α5, αv and NaBC1/BMPR1A co-localization.
a Images of nuclei (cyan) and co-localization dots (magenta) of MSCs cultured for 3 h onto functionalized substrates (FN-coated), serum-depleted and borax (PLLA-B2%, PLLA-B5%) in the culture medium. Scale bar represents 10 µm. b Image analysis quantification of the number of co-localization dots of NaBC1/α5, NaBC1/αv and NaBC1/BMPR1A. Co-localization levels increased with borax concentration. Thirty images/condition from three different biological replicas were analyzed. The data represented in graphs correspond to n ≥ 18. Statistics are shown as mean ± standard deviation. Data were analyzed by an ordinary one-way ANOVA test and corrected for multiple comparisons using Tukey analysis (P = 0.05). **p < 0.01, ***p < 0.001, ****p < 0.0001.

