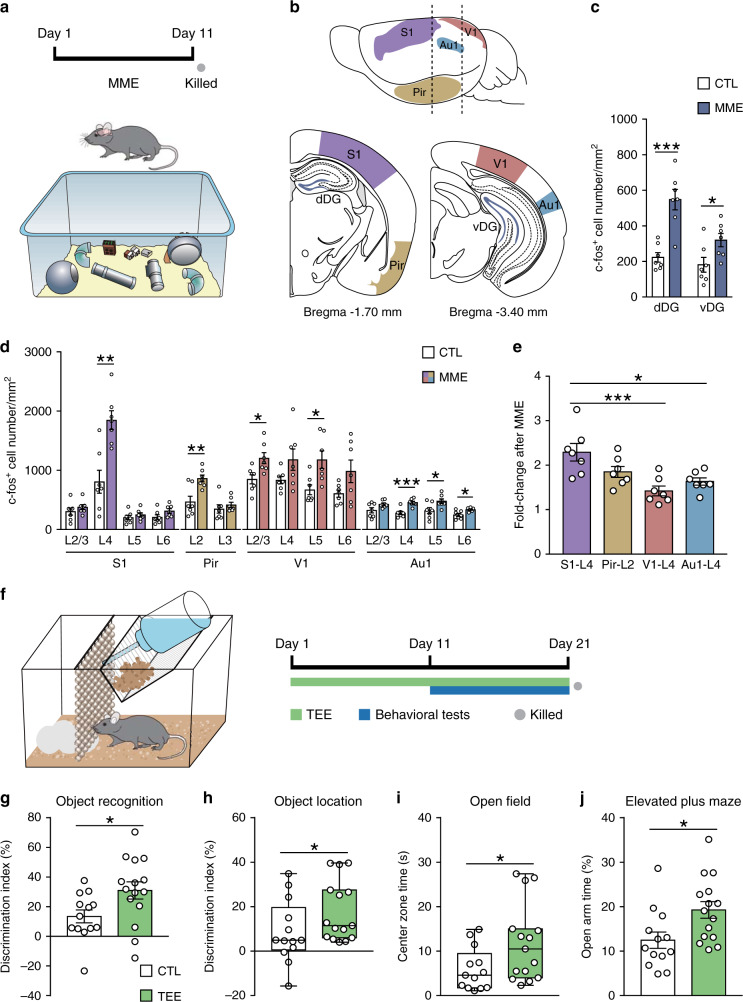
Fig. 1. Activation of cortical neurons after multimodal enrichment (MME) and the behavioral effects of tactile experience enrichment (TEE).
a MME cage setup and experimental timeline. n = 7 mice per group. b Lateral and coronal views of the regions of interest. Dashed lines in the top panel indicate the levels of two coronal sections shown in bottom panels. c The density of activated neurons in dorsal and ventral parts of DG was increased in the MME group compared to the control (CTL) group. d MME activated neurons in specific layers (L) of S1, Pir, V1, and Au1. e S1 layer 4 neurons showed higher degree of activation than layer 4 of V1 and Au1 after MME. f TEE cage design and experimental timeline. Mice were singly housed in standard cages provided with a row of glass bead curtain and a piece of cotton nesting material for 20 days. During the last 10 days of TEE, multiple memory and anxiety tests were performed. g Compared to CTL mice (n = 13), TEE mice (n = 15) showed better novel object recognition performance. h TEE enhanced spatial memory performance in the object location task. i TEE mice spent more time in the open field center than CTL mice. j TEE mice spent more time in open arms of the elevated plus maze than CTL mice. For bar charts, data are presented as mean ± SEM. For box plots in (h) and (i), circles represent data points, center lines indicate medians, the lower and upper bounds of boxes correspond to the 25th and 75th percentiles respectively, and whiskers indicate minima and maxima. *P < 0.05, **P < 0.01, ***P < 0.001. Detailed statistics are provided in Supplementary Table 2. Source data are provided as a Source Data file.

