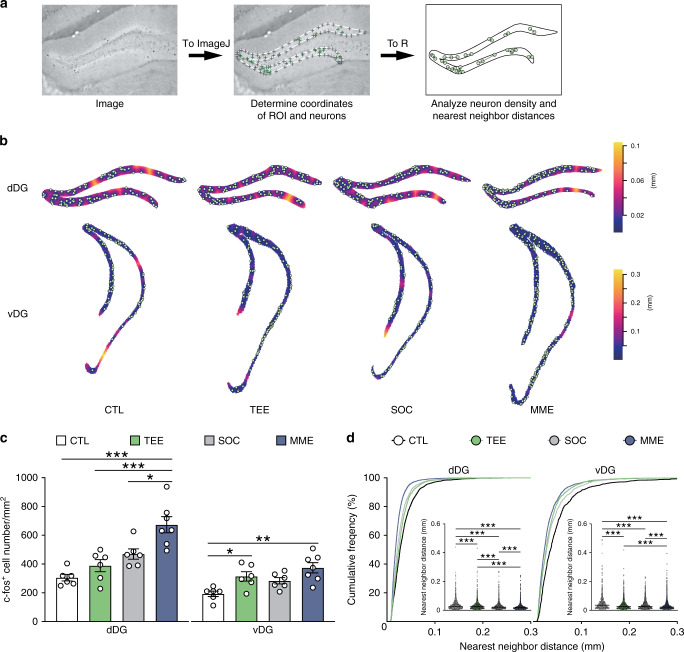
Fig. 2. Differential modulation of DG neuron activation by tactile enrichment and multimodal enrichment.
a The pipeline for the density and spatial distribution pattern analysis of c-fos+ neurons in DG. The image was imported to ImageJ to determine the coordinates of dentate granule cell layer (ROI, shown as gray crosses connected by a white line) and c-fos+ neurons (green crosses). After importing the coordinates of ROI and neurons to R, the density and nearest neighbor distances (indicated by single- or double-headed arrows) of c-fos+ neurons were analyzed by the spatstat package. b Representative plots of c-fos+ neurons superimposed on empty space distance maps of dDG and vDG from the control (CTL, n = 6), TEE (n = 6), social housing (SOC, n = 6), and MME (n = 7) groups. c TEE for 10 days increased neuronal activation in vDG, while MME increased c-fos+ neuron density in both dDG and vDG. d TEE, SOC and MME altered neuronal activation pattern in dDG and vDG. *P < 0.05, **P < 0.01, ***P < 0.001. Data in bar charts are presented as mean ± SEM. Detailed statistics are provided in Supplementary Table 2. Source data are provided as a Source Data file.

