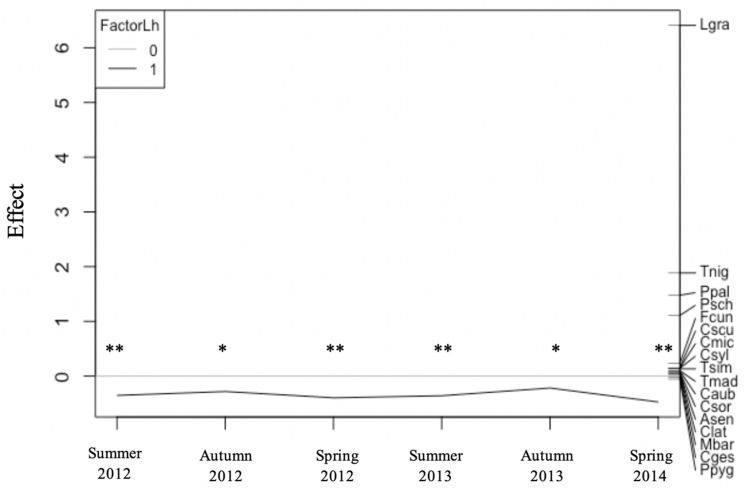
Figure 5.
Principal response curves (PRC) representing the effects of the invasion by the Argentine ant on native ants foraging on citrus tree canopy. The left y axis represents deviances from the control (uninvaded orchards). Significant deviances based on Monte Carlo permutation tests are marked with one (p < 0.05) or two asterisks (p < 0.001). The right side of the figure represents ant species weight, accounting for the deviances of the PRC. The first axis explains 96% of the variance of species–environment. Legend: 0—native ant community (gray reference line); 1—ant community affected by the Argentine ant invasion (black line); Lgra—Lasius grandis, Tnig—Tapinoma nigerrimum, Ppal—Pheidole pallidula, Psch—Plagiolepis schmitzii, Fcun—Formica cunicularia, Cscu—Crematogaster scutellaris, Cmic—Camponotus micans, Csyl—Camponotus sylvaticus, Tsim—Tapinoma simrothi, Tmad—Tapinoma madeirense, Caub—Crematogaster auberti, Csor—Crematogaster sordidula, Asen—Aphaenogaster senilis, Clat—Camponotus lateralis, Mbar—Messor barbarus, Cges—Camponotus gestroi, Ppyg—Plagiolepis pygmaea.

