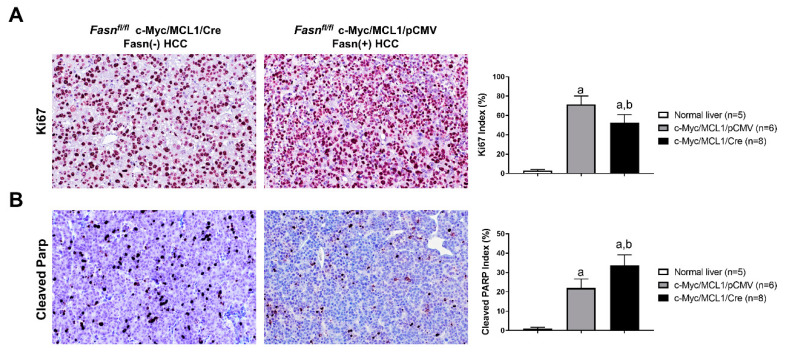
Figure 11.
Comparison of proliferation and apoptosis rates in liver lesions from c-Myc/MCL1/pCMV and c-Myc/MCL1/Cre mice. (A) Graphs and representative tissue images of proliferation rates in the two mouse models as assessed by evaluating the immunolabeling for Ki67. (B) Graphs and representative tissue images of apoptotic rates in the two mouse models as assessed by evaluating the percentage of cells positive for the Cleaved-Parp antibody. Data are expressed as means ± SD. A total of five normal livers, 6 liver tumor lesions from c-Myc/MCL1/pCMV, and 8 liver tumor lesions from c-Myc/MCL1/Cre mice were analyzed. Original magnification: 200×. Tukey–Kramer test: at least p < 0.0003; a, vs. normal liver; b, vs. c-Myc/MCL1/pCMV mice.

