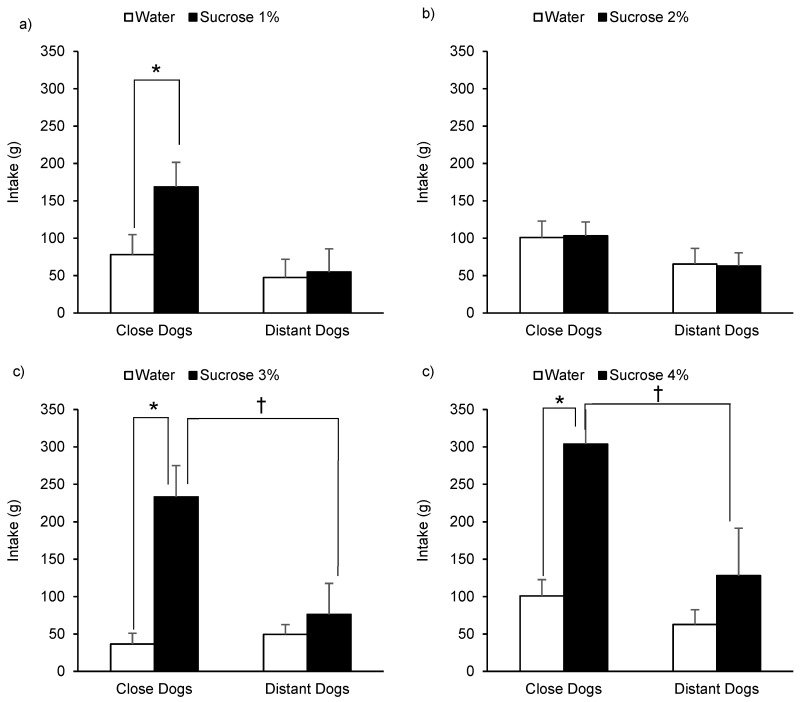
Figure 2.
Consumption (least square means + standard error) of kennelled dogs in front of 1% (a), 2% (b), 3% (c), and 4% (d) sucrose and water solutions during a 20 min two-choice preference test according to the human-approach test results (close or distant) previously assigned (* p < 0.05; † p < 0.1).

